Drawing prediction interval for OLS linear model
geom_lm_indicator.RdDrawing prediction interval for OLS linear model
geom_lm_indicator(
  mapping = NULL,
  data = NULL,
  position = "identity",
  na.rm = FALSE,
  show.legend = NA,
  inherit.aes = T,
  ...
)
Arguments
| ... |
|---|
Value
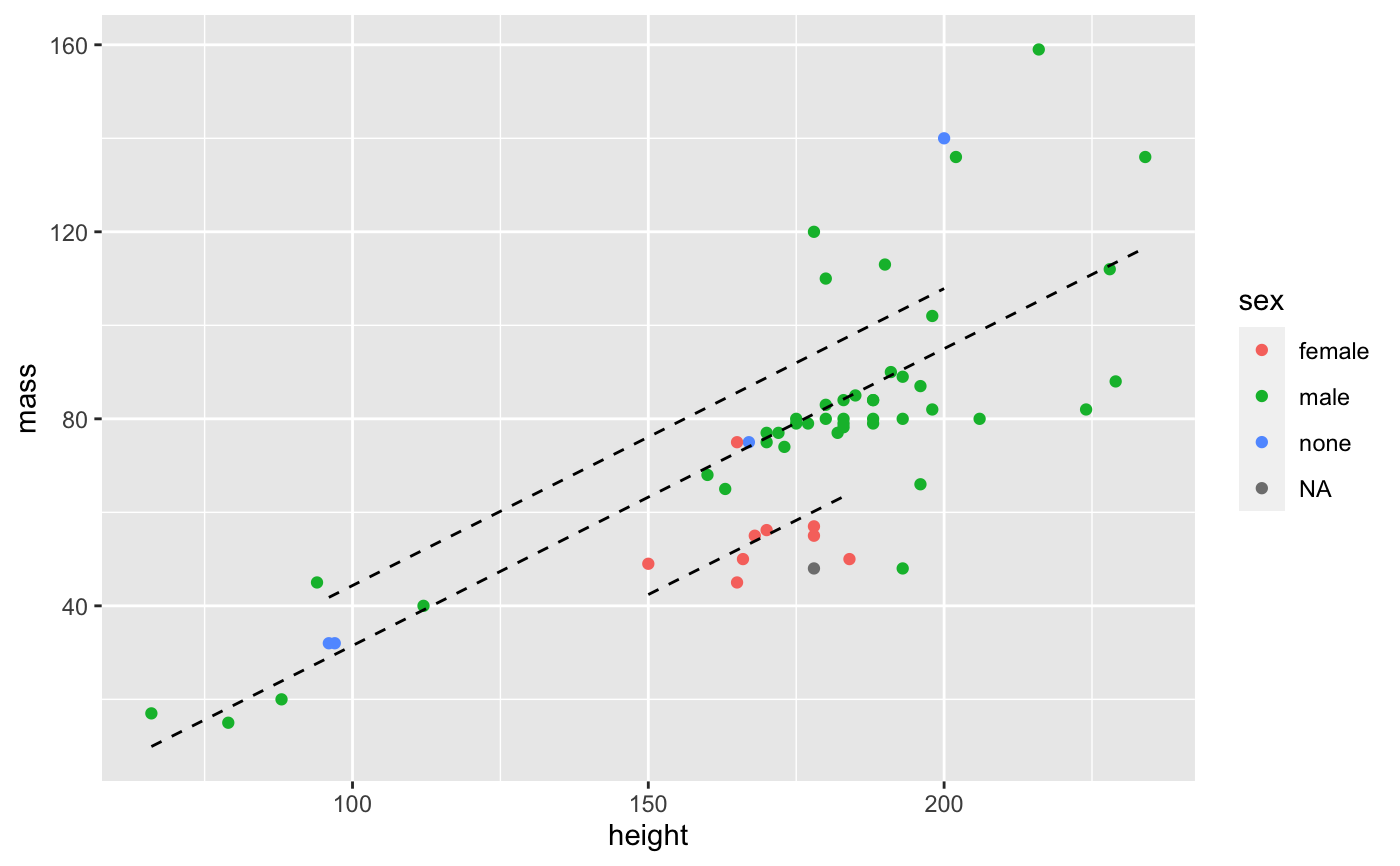
Examples
#> Warning: package ‘dplyr’ was built under R version 3.6.2#> #>#> #> #>#> #> #>starwars %>% filter(mass < 1000) %>% mutate(sex_numeric = sex %>% as.factor() %>% as.numeric()) %>% ggplot() + aes(x = height, y = mass, indicator_as_numeric = sex_numeric) + geom_point(aes(color = sex)) + geom_lm_indicator(linetype = "dashed")#> Warning: Removed 1 rows containing non-finite values (stat_olsindicator).