Drawing prediction interval for OLS linear model
geom_lm_pred_int.RdDrawing prediction interval for OLS linear model
geom_lm_pred_int(
  mapping = NULL,
  data = NULL,
  position = "identity",
  na.rm = FALSE,
  show.legend = NA,
  inherit.aes = TRUE,
  ...
)
Arguments
| ... |
|---|
Value
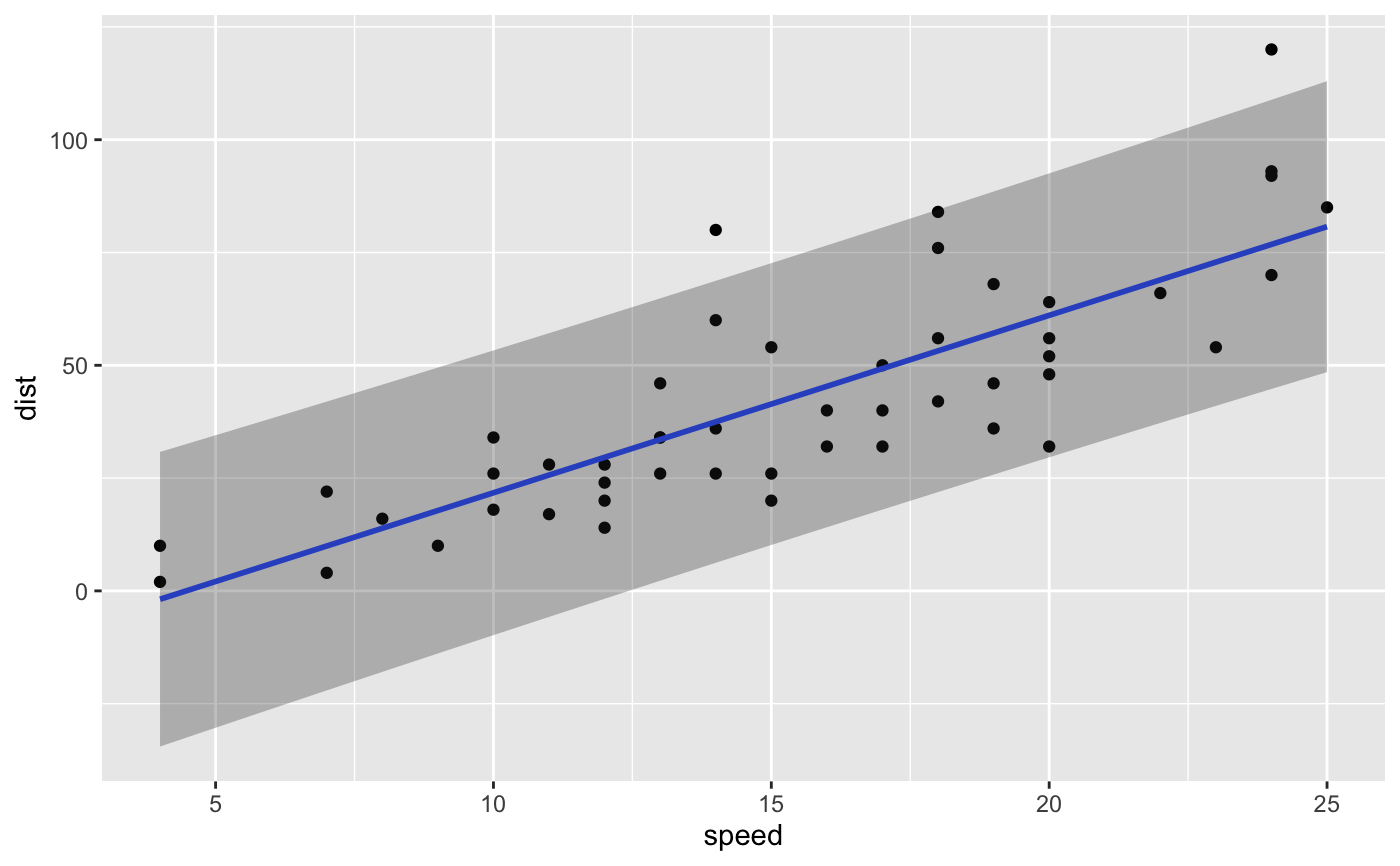
Examples
library(ggplot2)
ggplot(cars) + aes(x = speed, y = dist) +
geom_point() + geom_lm() + geom_lm_pred_int()