Lines defined by values of x
geom_x_line.RdLines defined by values of x
geom_x_line(
  mapping = NULL,
  data = NULL,
  ...,
  x,
  na.rm = FALSE,
  show.legend = NA
)
Arguments
| show.legend |
|---|
Value
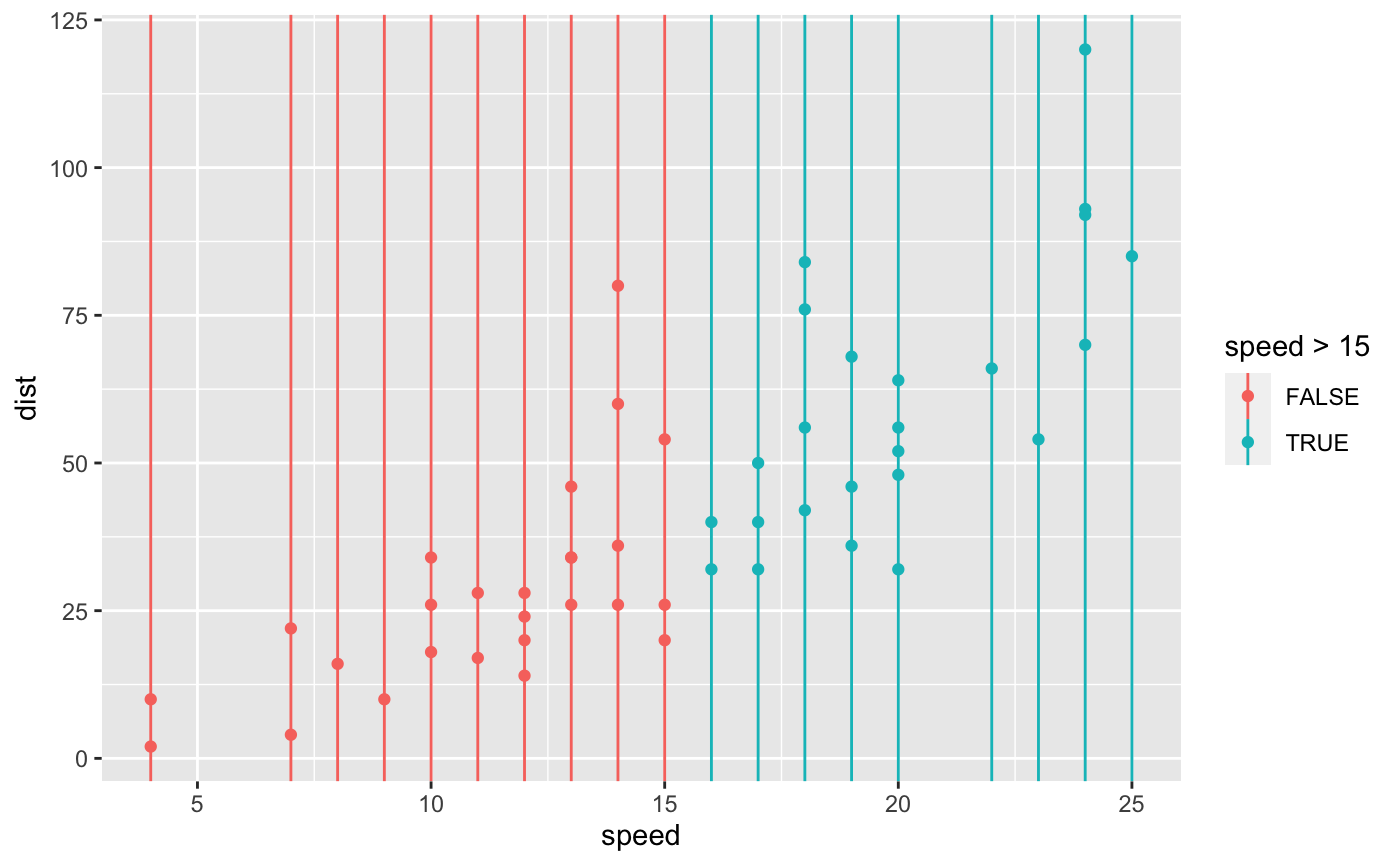
Examples
library(ggplot2)
ggplot(data = cars, mapping = aes(x = speed, y = dist)) +
geom_point() + geom_x_line() + aes(color = speed > 15)