Lines defined by quantile value of x
geom_x_quantile.RdLines defined by quantile value of x
geom_x_quantile(
  mapping = NULL,
  data = NULL,
  ...,
  x,
  na.rm = FALSE,
  show.legend = NA
)
Arguments
| show.legend |
|---|
Value
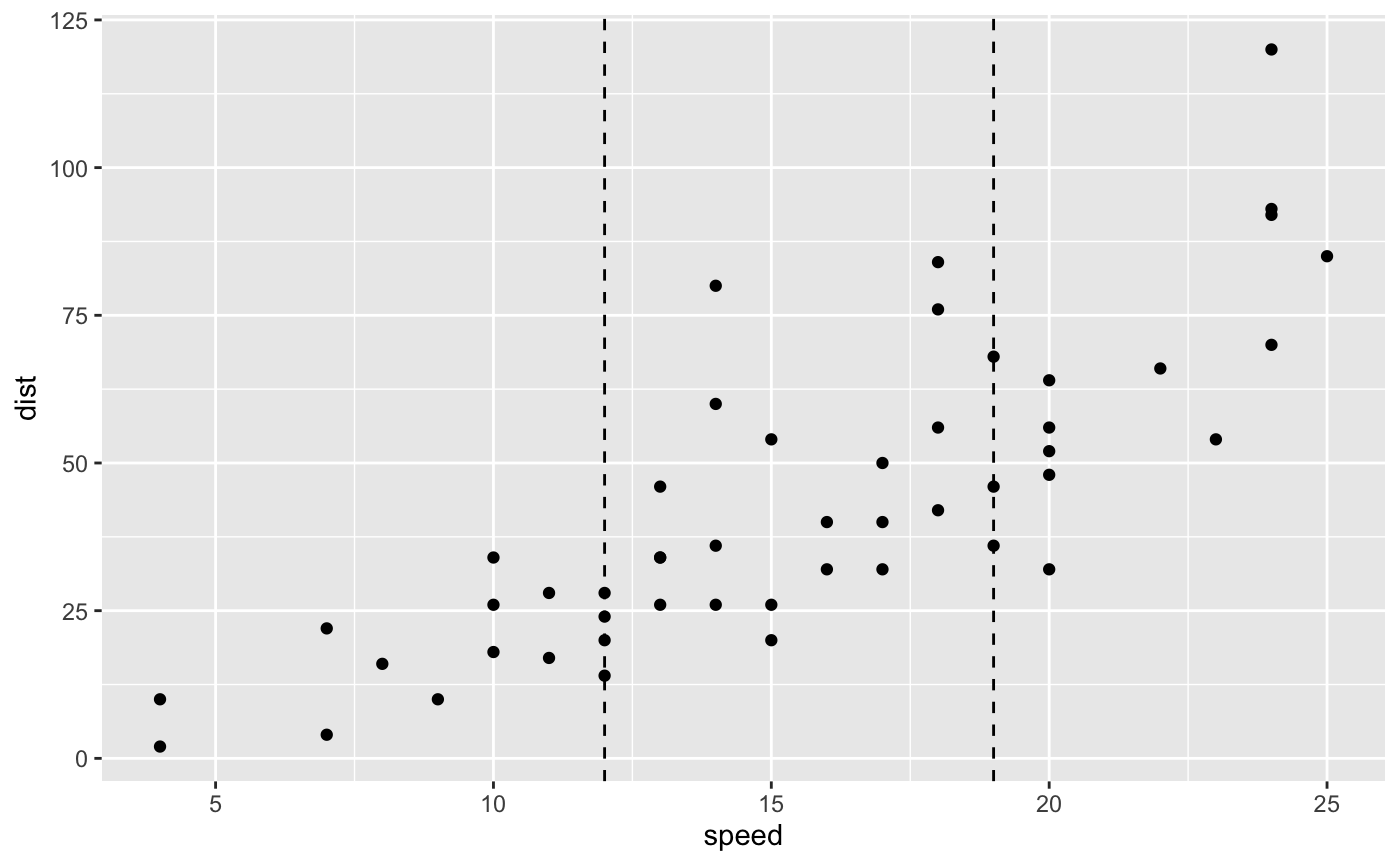
Examples
library(ggplot2)
ggplot(data = cars, mapping = aes(x = speed, y = dist)) +
geom_point() + geom_x_quantile(quantile = c(.25,.75), linetype = "dashed")