Place point at mean of x and mean of y
geom_xy_means.RdPlace point at mean of x and mean of y
geom_xy_means(
  mapping = NULL,
  data = NULL,
  position = "identity",
  na.rm = FALSE,
  show.legend = NA,
  inherit.aes = TRUE,
  ...
)
Arguments
| ... |
|---|
Value
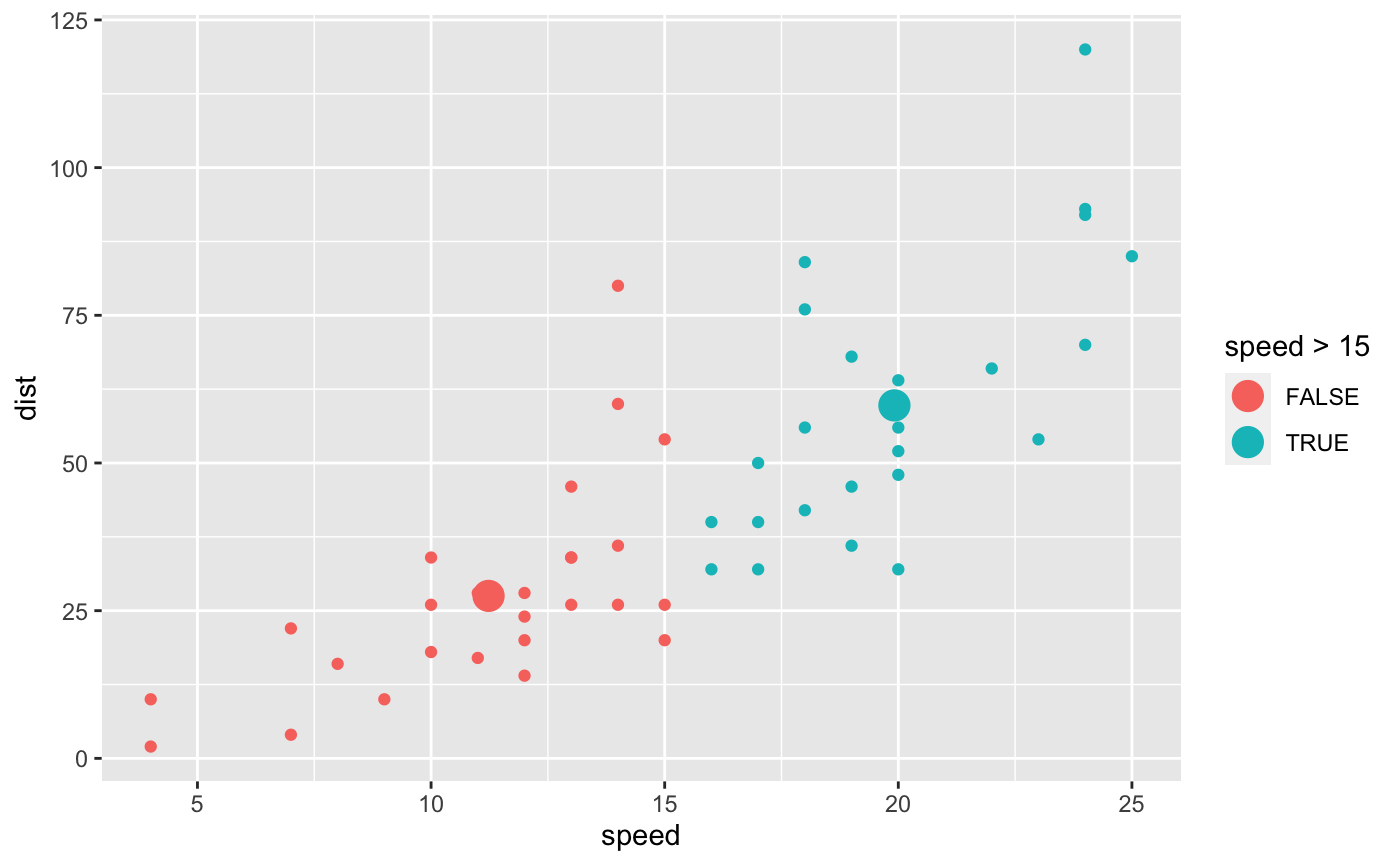
Examples
library(ggplot2)
ggplot(cars) + aes(x = speed, y = dist) +
geom_point() + geom_xy_means(size = 5) + aes(color = speed > 15)