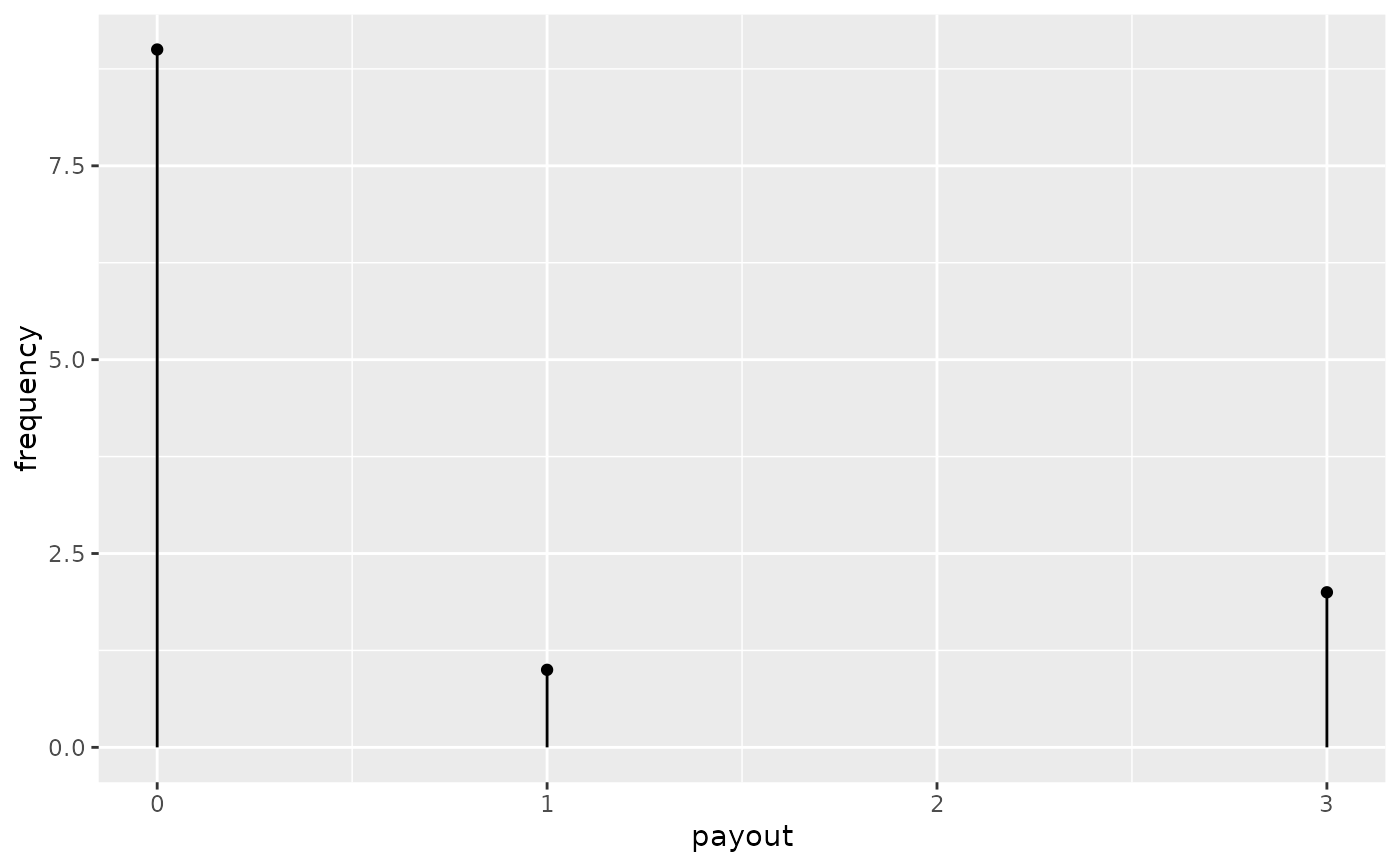
The lollipop is often used to attractively communicate about discrete quantitative distributions.
Usage
geom_lollipop(annotate =FALSE, ...)
Value
a ggplot geom layer
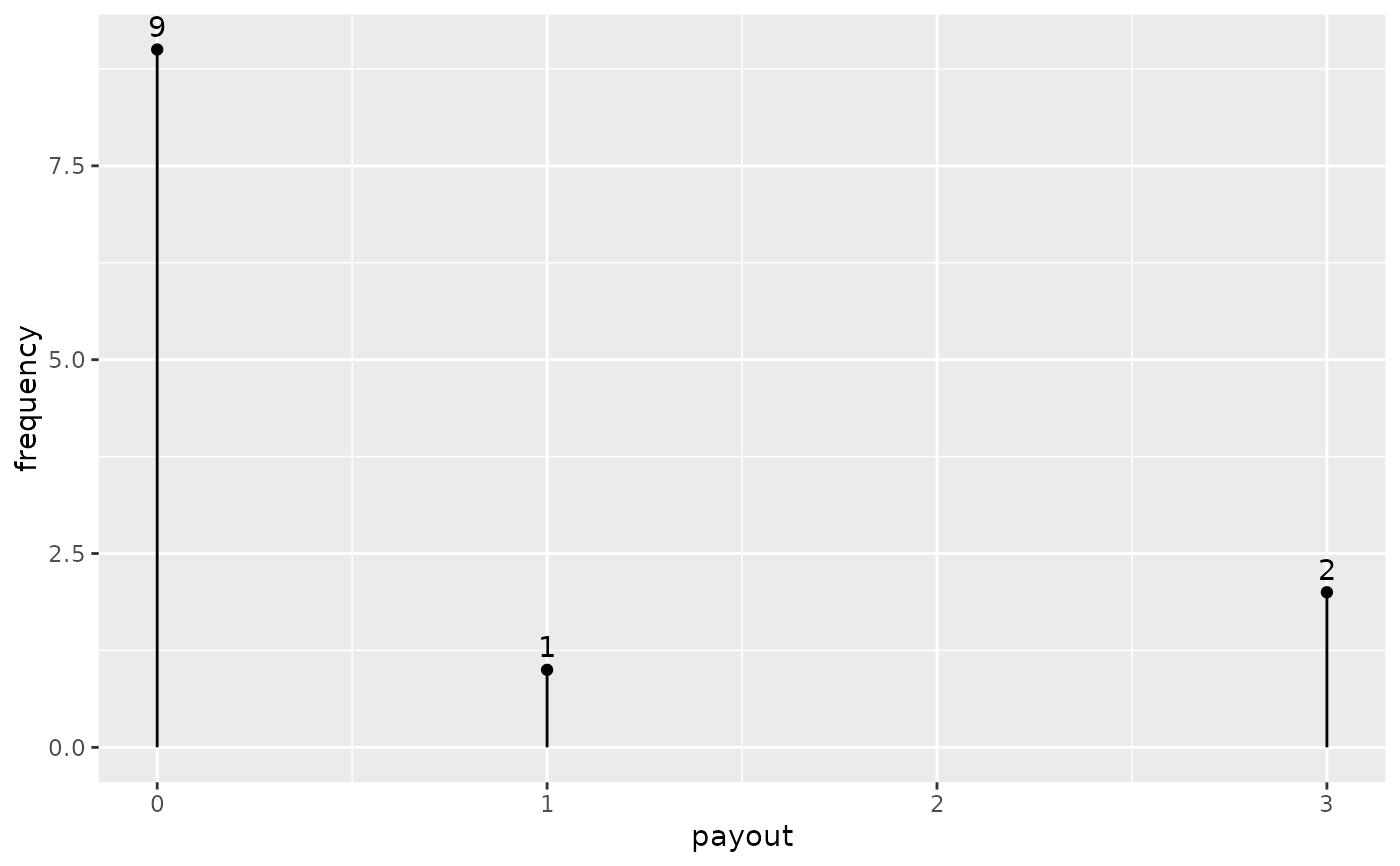
Examples
library(ggplot2)ggplot(data =prize_wheel)+aes(x =payout, y =frequency)+geom_lollipop()library(ggplot2)ggplot(data =prize_wheel)+aes(x =payout, y =frequency)+geom_lollipop(annotate =TRUE)