geom_post.Rd
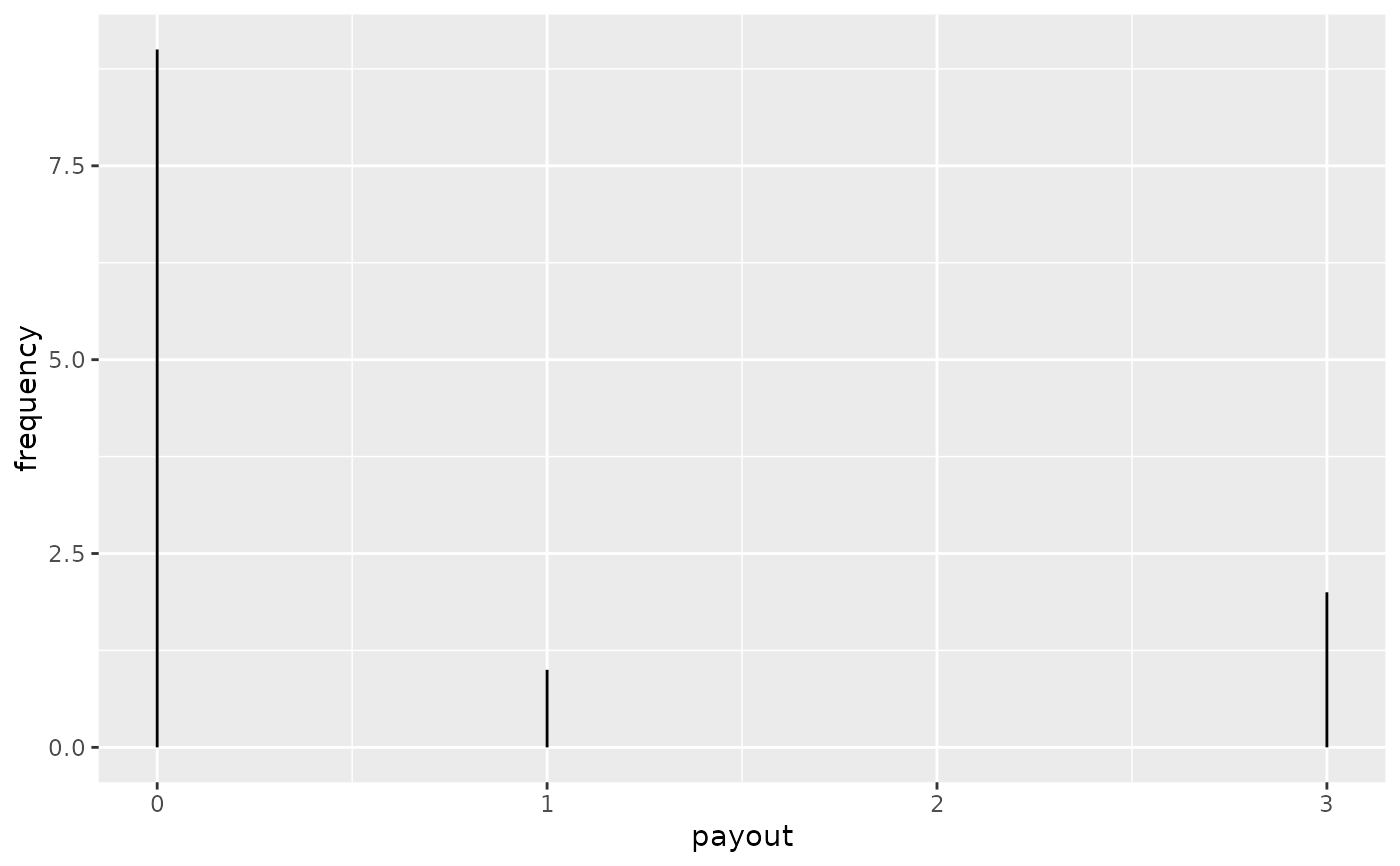
geom_post() may be used to visualize discrete quantitative distributions
geom_post(
  mapping = NULL,
  data = NULL,
  position = "identity",
  na.rm = FALSE,
  show.legend = NA,
  inherit.aes = TRUE,
  ...
)
a ggplot2 geom layer
library(ggplot2)
ggplot(data = prize_wheel) +
aes(x = payout, y = frequency) +
geom_post()