stamp_dbinom
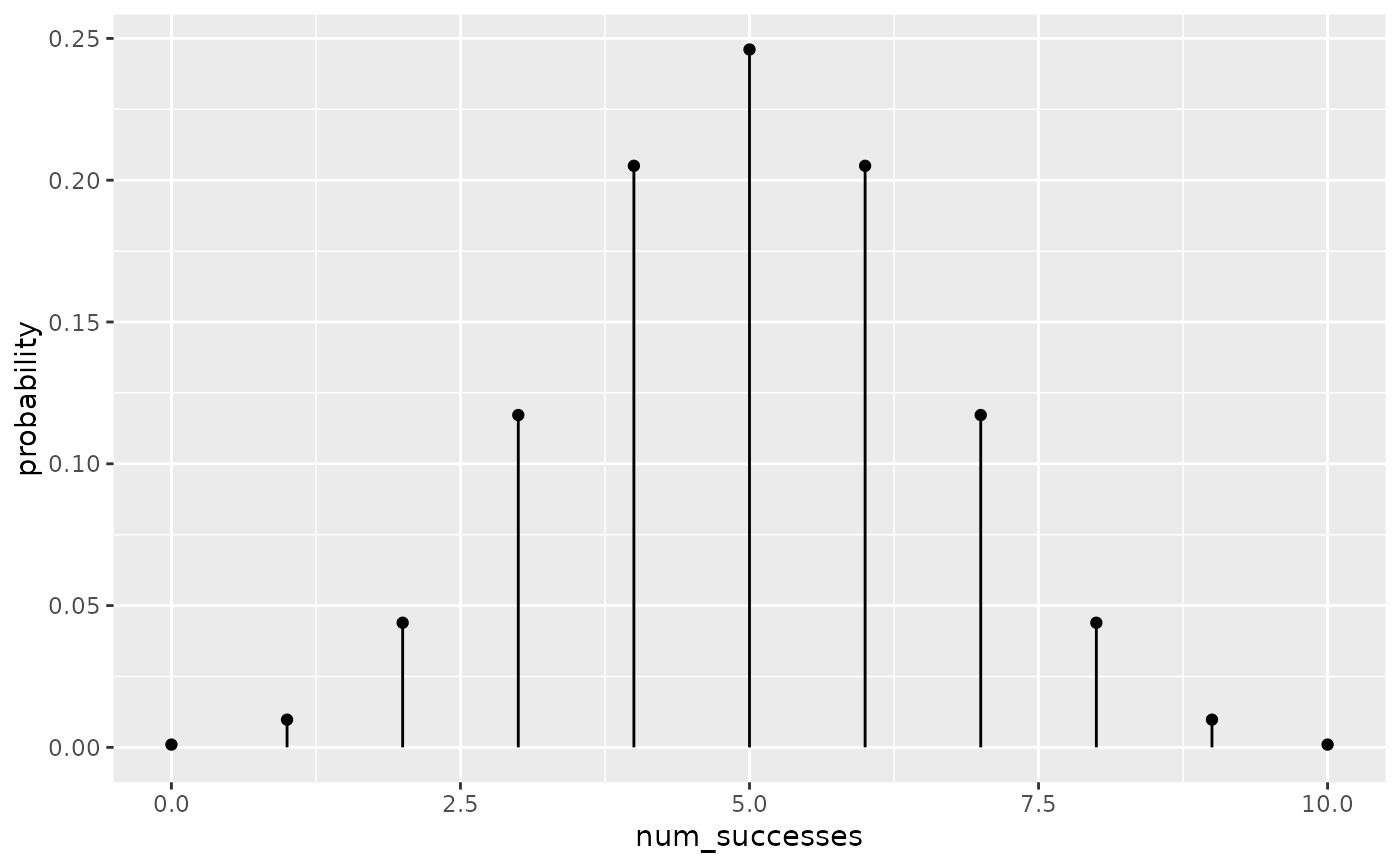
stamp_dbinom.Rdstamp_dbinom returns a plot that plots the number of successes with probabilities given the probability of a single trial and the total number of trials.
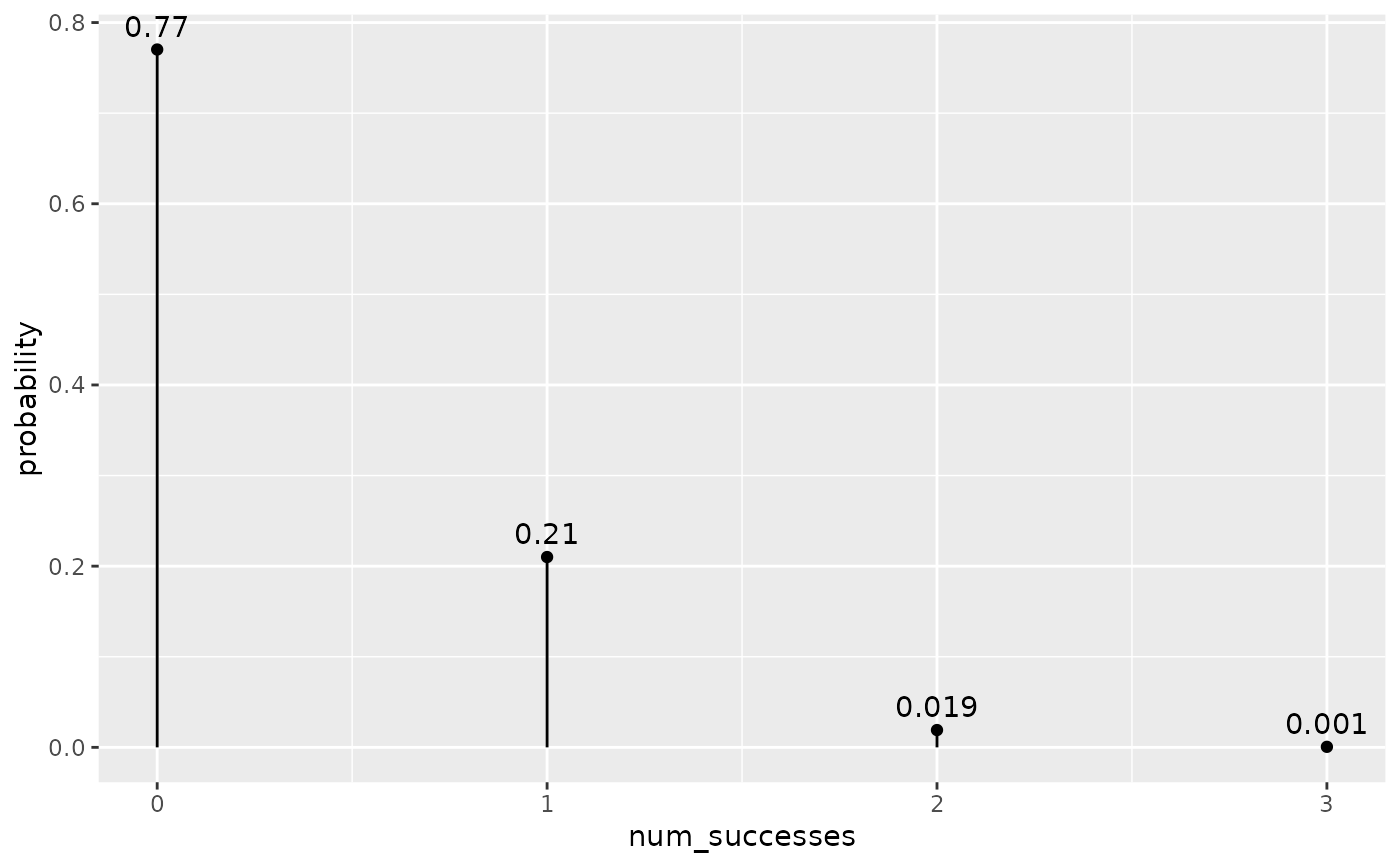
stamp_dbinom.Rdstamp_dbinom returns a plot that plots the number of successes with probabilities given the probability of a single trial and the total number of trials.