count: false .panel1-the_chunk-user[ ``` r *library(tidyverse) *library(legendry) *data.frame( * category = c("Meat", "Meat", "Vegetables", "Vegetables", "Dairy"), * food = c("Beef", "Chicken", "Carrots", "Onions", "Cheese"), * gram = c(85, 85, 150, 210, 225), * calories = c(245, 185, 45, 80, 240)) %>% * mutate(food_category = interaction(food, category)) |> * mutate(category_food = paste(category, food)) |> * ggplot() + * aes(x = food_category, * y = calories) + * theme_classic(base_size = 15) ``` ] .panel2-the_chunk-user[ 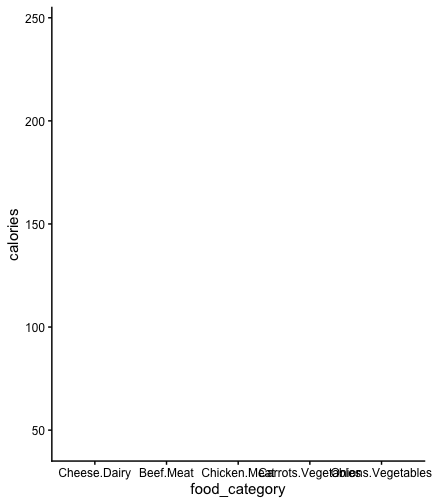<!-- --> ] --- count: false .panel1-the_chunk-user[ ``` r library(tidyverse) library(legendry) data.frame( category = c("Meat", "Meat", "Vegetables", "Vegetables", "Dairy"), food = c("Beef", "Chicken", "Carrots", "Onions", "Cheese"), gram = c(85, 85, 150, 210, 225), calories = c(245, 185, 45, 80, 240)) %>% mutate(food_category = interaction(food, category)) |> mutate(category_food = paste(category, food)) |> ggplot() + aes(x = food_category, y = calories) + theme_classic(base_size = 15) + * geom_col() ``` ] .panel2-the_chunk-user[ 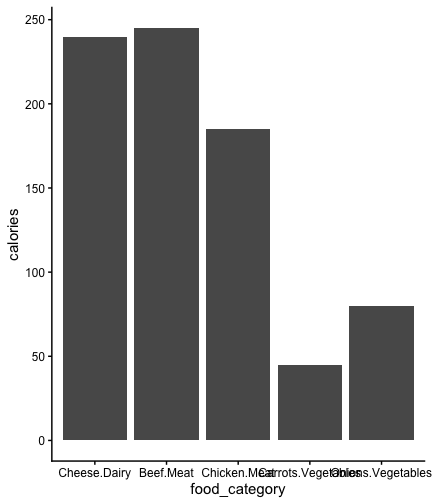<!-- --> ] --- count: false .panel1-the_chunk-user[ ``` r library(tidyverse) library(legendry) data.frame( category = c("Meat", "Meat", "Vegetables", "Vegetables", "Dairy"), food = c("Beef", "Chicken", "Carrots", "Onions", "Cheese"), gram = c(85, 85, 150, 210, 225), calories = c(245, 185, 45, 80, 240)) %>% mutate(food_category = interaction(food, category)) |> mutate(category_food = paste(category, food)) |> ggplot() + aes(x = food_category, y = calories) + theme_classic(base_size = 15) + geom_col() + * guides(x = "axis_nested") ``` ] .panel2-the_chunk-user[ 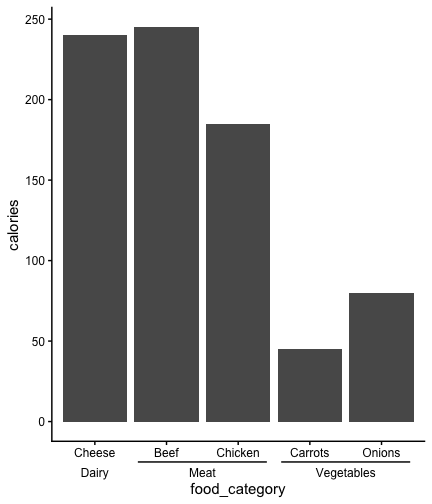<!-- --> ] --- count: false .panel1-the_chunk-user[ ``` r library(tidyverse) library(legendry) data.frame( category = c("Meat", "Meat", "Vegetables", "Vegetables", "Dairy"), food = c("Beef", "Chicken", "Carrots", "Onions", "Cheese"), gram = c(85, 85, 150, 210, 225), calories = c(245, 185, 45, 80, 240)) %>% mutate(food_category = interaction(food, category)) |> mutate(category_food = paste(category, food)) |> ggplot() + aes(x = food_category, y = calories) + theme_classic(base_size = 15) + geom_col() + guides(x = "axis_nested") + * aes(fill = category_food) ``` ] .panel2-the_chunk-user[ 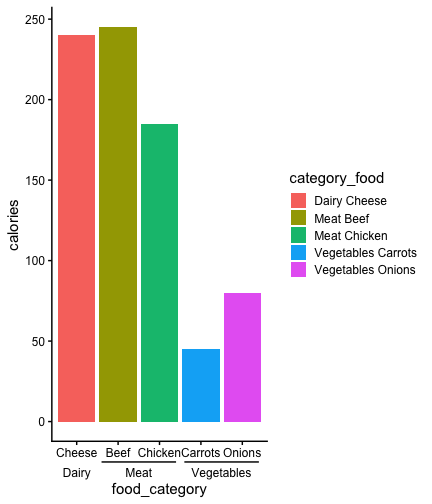<!-- --> ] --- count: false .panel1-the_chunk-user[ ``` r library(tidyverse) library(legendry) data.frame( category = c("Meat", "Meat", "Vegetables", "Vegetables", "Dairy"), food = c("Beef", "Chicken", "Carrots", "Onions", "Cheese"), gram = c(85, 85, 150, 210, 225), calories = c(245, 185, 45, 80, 240)) %>% mutate(food_category = interaction(food, category)) |> mutate(category_food = paste(category, food)) |> ggplot() + aes(x = food_category, y = calories) + theme_classic(base_size = 15) + geom_col() + guides(x = "axis_nested") + aes(fill = category_food) + * guides(fill = "legend_group") ``` ] .panel2-the_chunk-user[ <!-- --> ] --- count: false .panel1-the_chunk-user[ ``` r library(tidyverse) library(legendry) data.frame( category = c("Meat", "Meat", "Vegetables", "Vegetables", "Dairy"), food = c("Beef", "Chicken", "Carrots", "Onions", "Cheese"), gram = c(85, 85, 150, 210, 225), calories = c(245, 185, 45, 80, 240)) %>% mutate(food_category = interaction(food, category)) |> mutate(category_food = paste(category, food)) |> ggplot() + aes(x = food_category, y = calories) + theme_classic(base_size = 15) + geom_col() + guides(x = "axis_nested") + aes(fill = category_food) + guides(fill = "legend_group") + * labs(x = NULL, fill = NULL) ``` ] .panel2-the_chunk-user[ <!-- --> ] --- count: false .panel1-the_chunk-user[ ``` r library(tidyverse) library(legendry) data.frame( category = c("Meat", "Meat", "Vegetables", "Vegetables", "Dairy"), food = c("Beef", "Chicken", "Carrots", "Onions", "Cheese"), gram = c(85, 85, 150, 210, 225), calories = c(245, 185, 45, 80, 240)) %>% mutate(food_category = interaction(food, category)) |> mutate(category_food = paste(category, food)) |> ggplot() + aes(x = food_category, y = calories) + theme_classic(base_size = 15) + geom_col() + guides(x = "axis_nested") + aes(fill = category_food) + guides(fill = "legend_group") + labs(x = NULL, fill = NULL) + * guides(y = guide_axis_nested( * key_range_manual(start = 0, end = 100, * name = "low calories")) * ) ``` ] .panel2-the_chunk-user[ <!-- --> ] --- count: false .panel1-the_chunk-user[ ``` r library(tidyverse) library(legendry) data.frame( category = c("Meat", "Meat", "Vegetables", "Vegetables", "Dairy"), food = c("Beef", "Chicken", "Carrots", "Onions", "Cheese"), gram = c(85, 85, 150, 210, 225), calories = c(245, 185, 45, 80, 240)) %>% mutate(food_category = interaction(food, category)) |> mutate(category_food = paste(category, food)) |> ggplot() + aes(x = food_category, y = calories) + theme_classic(base_size = 15) + geom_col() + guides(x = "axis_nested") + aes(fill = category_food) + guides(fill = "legend_group") + labs(x = NULL, fill = NULL) + guides(y = guide_axis_nested( key_range_manual(start = 0, end = 100, name = "low calories")) ) + * theme(axis.text.y.left = * element_text(angle = 90, hjust = 0.5)) + * theme(axis.ticks.x = element_blank()) + * scale_y_continuous(expand = expansion(mult = c(0, .2))) ``` ] .panel2-the_chunk-user[ <!-- --> ] <style> .panel1-the_chunk-user { color: black; width: 39.2%; hight: 32%; float: left; padding-left: 1%; font-size: 80% } .panel2-the_chunk-user { color: black; width: 58.8%; hight: 32%; float: left; padding-left: 1%; font-size: 80% } .panel3-the_chunk-user { color: black; width: NA%; hight: 33%; float: left; padding-left: 1%; font-size: 80% } </style> <style type="text/css"> .remark-code{line-height: 1.5; font-size: 100%} @media print { .has-continuation { display: block; } } code.r.hljs.remark-code{ position: relative; overflow-x: hidden; } code.r.hljs.remark-code:hover{ overflow-x:visible; width: 500px; border-style: solid; } </style>