ggplot(cars) +
  aes(x = speed, y = dist) +
  geom_point() +
  geom_smooth()
Graphical poems with ggplot2.
Closeread enables scrollytelling.
ggplot2 allows you build up your plot bit by bit - to write ‘graphical poems’ (Wickham 2010). It is easy to gain insights simply by defining what aes
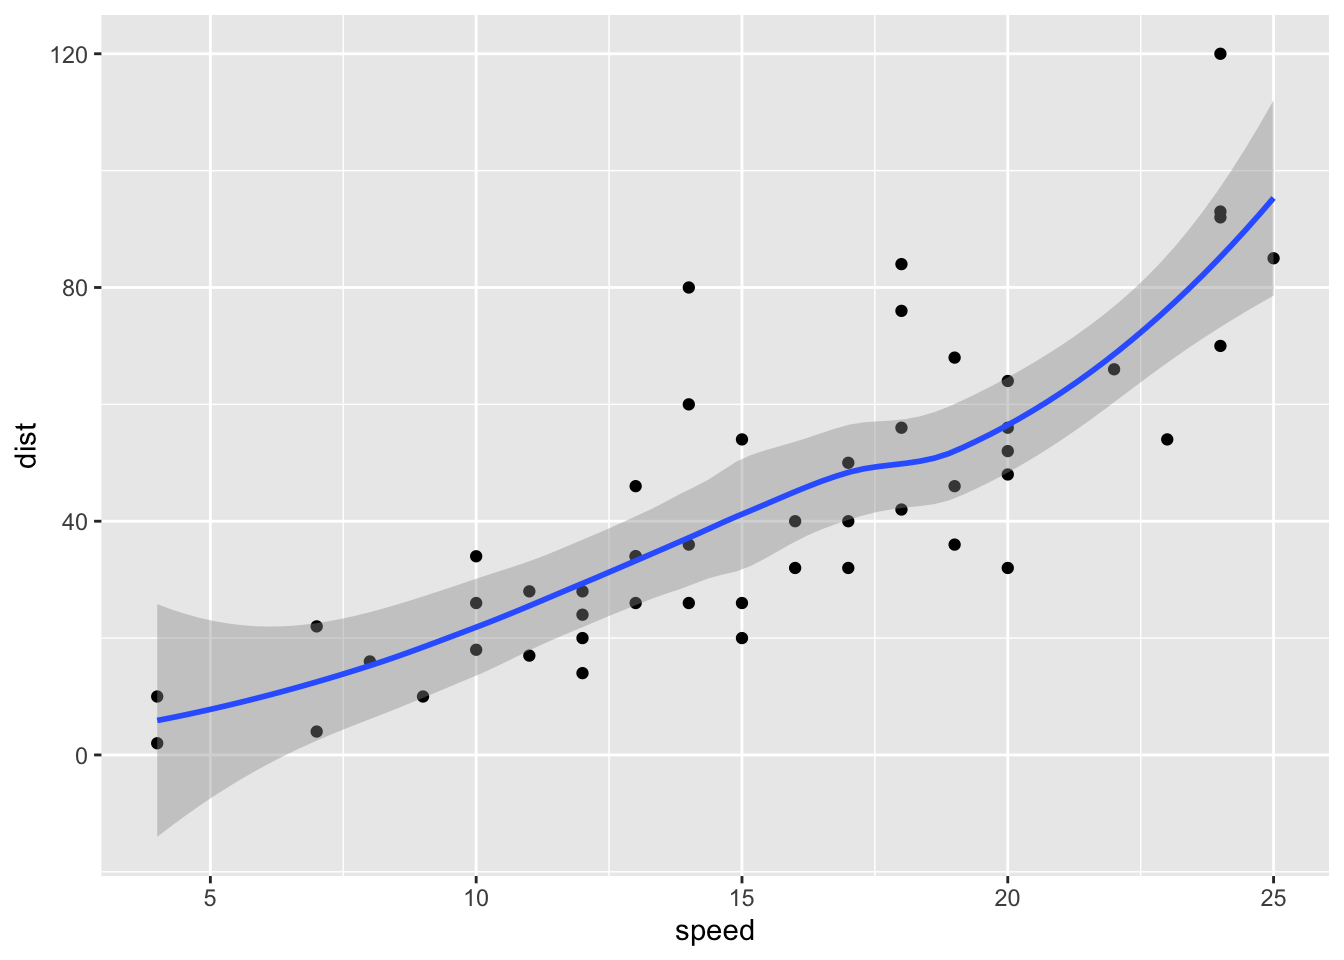
Here is a graphical poem!
ggplot(cars) +
aes(x = speed, y = dist) +
geom_point() +
geom_smooth()
But let’s read it ‘aloud’ now…
knitr::knit_code$get("walkthrough") |>
  str_remove("\\s*?\\+$") |>
  tibble(code = _) |>
  mutate(index = row_number()) |>
  mutate(plot_name = paste("walkthrough", sep = "-", index)) |>
  mutate(explosion = cr_last_plot_construction) |>
  mutate(explosion = str_replace_all(explosion, ".PLOTXXX", plot_name)) |>
  mutate(explosion = str_replace(explosion, ".COMMENT", "")) |>
  mutate(explosion = str_replace_all(explosion, ".CODE", code)) |>
  mutate(explosion = str_replace(explosion, ".LEADING", ifelse(index == 1, "", "last_plot() +"))) |>
  pull(explosion) ->
to_closeread
, ggplot(cars)
, aes(x = speed, y = dist)
, geom_point()
, geom_smooth()
ggplot(cars)
last_plot() +
    aes(x = speed, y = dist)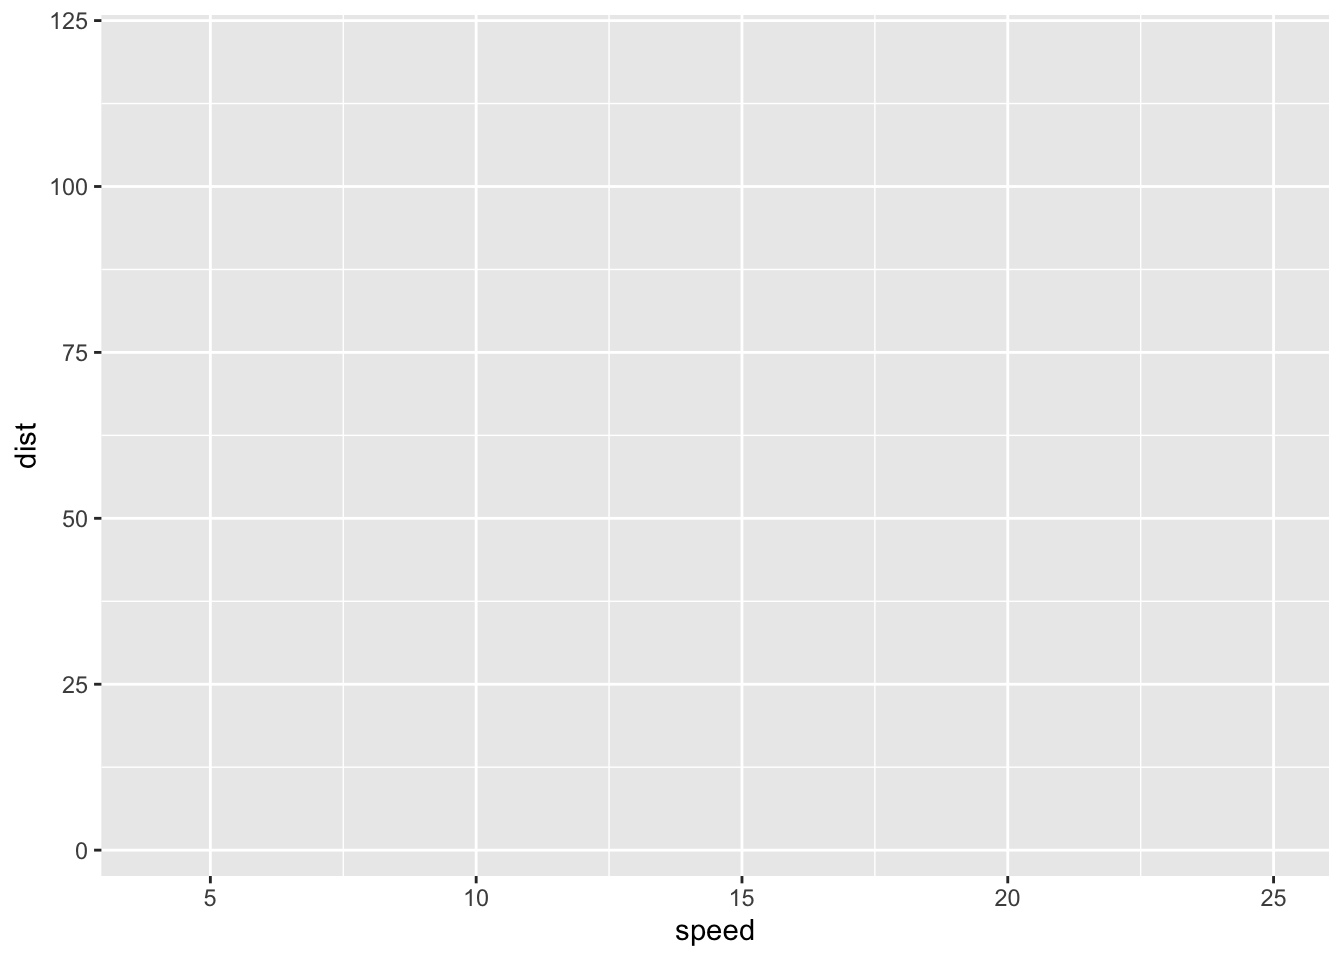
last_plot() +
    geom_point()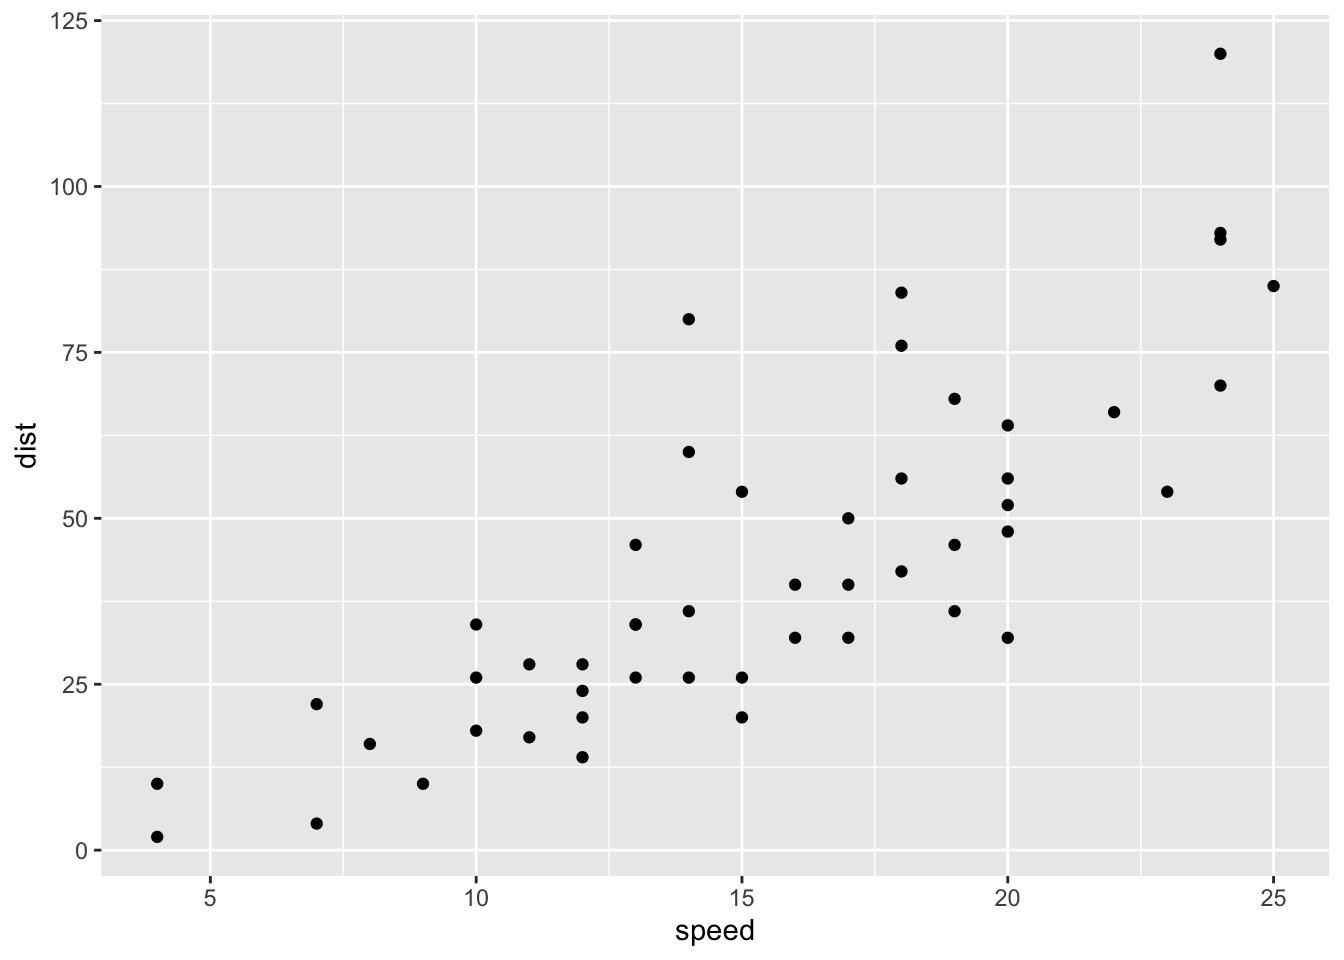
last_plot() +
    geom_smooth()