# A tibble: 500 × 11
    year   age sex    college   partyid hompop hours income class finrela weight
   <dbl> <dbl> <fct>  <fct>     <fct>    <dbl> <dbl> <ord>  <fct> <fct>    <dbl>
 1  2014    36 male   degree    ind          3    50 $2500… midd… below …  0.896
 2  1994    34 female no degree rep          4    31 $2000… work… below …  1.08
 3  1998    24 male   degree    ind          1    40 $2500… work… below …  0.550
 4  1996    42 male   no degree ind          4    40 $2500… work… above …  1.09
 5  1994    31 male   degree    rep          2    40 $2500… midd… above …  1.08
 6  1996    32 female no degree rep          4    53 $2500… midd… average  1.09
 7  1990    48 female no degree dem          2    32 $2500… work… below …  1.06
 8  2016    36 female degree    ind          1    20 $2500… midd… above …  0.478
 9  2000    30 female degree    rep          5    40 $2500… midd… average  1.10
10  1998    33 female no degree dem          2    40 $1500… work… far be…  0.550
# ℹ 490 more rows# A tibble: 500 × 11
year age sex college partyid hompop hours income class finrela weight
<dbl> <dbl> <fct> <fct> <fct> <dbl> <dbl> <ord> <fct> <fct> <dbl>
1 2014 36 male degree ind 3 50 $2500… midd… below … 0.896
2 1994 34 female no degree rep 4 31 $2000… work… below … 1.08
3 1998 24 male degree ind 1 40 $2500… work… below … 0.550
4 1996 42 male no degree ind 4 40 $2500… work… above … 1.09
5 1994 31 male degree rep 2 40 $2500… midd… above … 1.08
6 1996 32 female no degree rep 4 53 $2500… midd… average 1.09
7 1990 48 female no degree dem 2 32 $2500… work… below … 1.06
8 2016 36 female degree ind 1 20 $2500… midd… above … 0.478
9 2000 30 female degree rep 5 40 $2500… midd… average 1.10
10 1998 33 female no degree dem 2 40 $1500… work… far be… 0.550
# ℹ 490 more rowsResponse: age (numeric)
Explanatory: partyid (factor)
# A tibble: 500 × 2
age partyid
<dbl> <fct>
1 36 ind
2 34 rep
3 24 ind
4 42 ind
5 31 rep
6 32 rep
7 48 dem
8 36 ind
9 30 rep
10 33 dem
# ℹ 490 more rowsResponse: age (numeric)
Explanatory: partyid (factor)
Null Hypothesis: indepe...
# A tibble: 500 × 2
age partyid
<dbl> <fct>
1 36 ind
2 34 rep
3 24 ind
4 42 ind
5 31 rep
6 32 rep
7 48 dem
8 36 ind
9 30 rep
10 33 dem
# ℹ 490 more rowsResponse: age (numeric)
Explanatory: partyid (factor)
Null Hypothesis: indepe...
# A tibble: 500,000 × 3
# Groups: replicate [1,000]
age partyid replicate
<dbl> <fct> <int>
1 33 ind 1
2 30 rep 1
3 60 ind 1
4 29 ind 1
5 22 rep 1
6 34 rep 1
7 47 dem 1
8 61 ind 1
9 37 rep 1
10 66 dem 1
# ℹ 499,990 more rowsResponse: age (numeric)
Explanatory: partyid (factor)
Null Hypothesis: indepe...
# A tibble: 1,000 × 2
replicate stat
<int> <dbl>
1 1 4.60
2 2 0.352
3 3 0.260
4 4 1.26
5 5 0.291
6 6 0.243
7 7 0.866
8 8 0.665
9 9 0.147
10 10 1.74
# ℹ 990 more rows
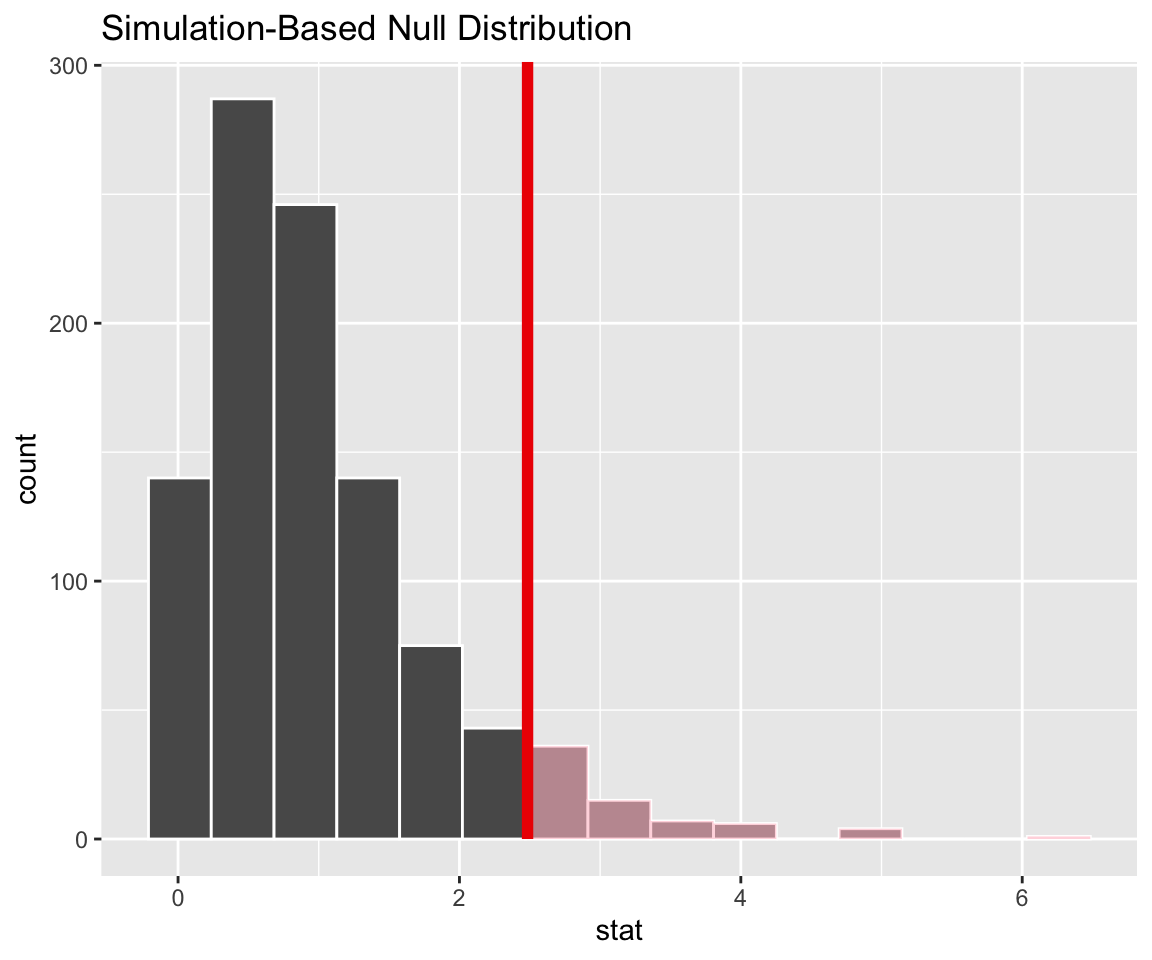
library(infer)

gss |> tibble() |>
  specify(age ~ partyid) |>
  calculate(stat = "F") ->
F_hat

gss |>
  specify(age ~ partyid) |>
  hypothesize(null = "independence") |>
  generate(reps = 1000,
           type = "permute") |>
  calculate(stat = "F") |>
  visualize() +
  shade_p_value(obs_stat = F_hat,  #<<
                direction = "greater")  #<<