count: false .panel1-the_chunk-auto[ ``` r *ggpairs_piped(tips) # simple start univariate plots ``` ] .panel2-the_chunk-auto[ 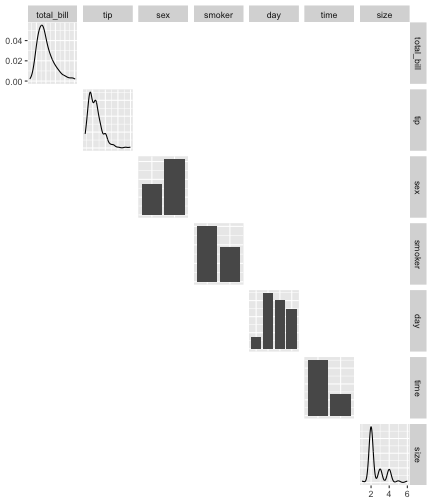<!-- --> ] --- count: false .panel1-the_chunk-auto[ ``` r ggpairs_piped(tips) |> # simple start univariate plots # to ggpairs - pairwise plots set_lower() ``` ] .panel2-the_chunk-auto[ <!-- --> ] --- count: false .panel1-the_chunk-auto[ ``` r ggpairs_piped(tips) |> # simple start univariate plots # to ggpairs - pairwise plots set_lower() |> set_upper() ``` ] .panel2-the_chunk-auto[ <!-- --> ] --- count: false .panel1-the_chunk-auto[ ``` r ggpairs_piped(tips) |> # simple start univariate plots # to ggpairs - pairwise plots set_lower() |> set_upper() |> # Columns and Mapping set_columns(c("tip", "total_bill", "time", "smoker")) ``` ] .panel2-the_chunk-auto[ <!-- --> ] --- count: false .panel1-the_chunk-auto[ ``` r ggpairs_piped(tips) |> # simple start univariate plots # to ggpairs - pairwise plots set_lower() |> set_upper() |> # Columns and Mapping set_columns(c("tip", "total_bill", "time", "smoker")) |> set_columns(c( 2, 1, 6, 4)) ``` ] .panel2-the_chunk-auto[ <!-- --> ] --- count: false .panel1-the_chunk-auto[ ``` r ggpairs_piped(tips) |> # simple start univariate plots # to ggpairs - pairwise plots set_lower() |> set_upper() |> # Columns and Mapping set_columns(c("tip", "total_bill", "time", "smoker")) |> set_columns(c( 2, 1, 6, 4)) |> set_columnLabels( c("Tip", "Total Bill", "Time of Day", "Smoker")) ``` ] .panel2-the_chunk-auto[ <!-- --> ] --- count: false .panel1-the_chunk-auto[ ``` r ggpairs_piped(tips) |> # simple start univariate plots # to ggpairs - pairwise plots set_lower() |> set_upper() |> # Columns and Mapping set_columns(c("tip", "total_bill", "time", "smoker")) |> set_columns(c( 2, 1, 6, 4)) |> set_columnLabels( c("Tip", "Total Bill", "Time of Day", "Smoker")) |> set_mapping(aes(color = time)) ``` ] .panel2-the_chunk-auto[ <!-- --> ] --- count: false .panel1-the_chunk-auto[ ``` r ggpairs_piped(tips) |> # simple start univariate plots # to ggpairs - pairwise plots set_lower() |> set_upper() |> # Columns and Mapping set_columns(c("tip", "total_bill", "time", "smoker")) |> set_columns(c( 2, 1, 6, 4)) |> set_columnLabels( c("Tip", "Total Bill", "Time of Day", "Smoker")) |> set_mapping(aes(color = time)) |> set_mapping(aes(color = time, alpha = I(.7))) ``` ] .panel2-the_chunk-auto[ <!-- --> ] --- count: false .panel1-the_chunk-auto[ ``` r ggpairs_piped(tips) |> # simple start univariate plots # to ggpairs - pairwise plots set_lower() |> set_upper() |> # Columns and Mapping set_columns(c("tip", "total_bill", "time", "smoker")) |> set_columns(c( 2, 1, 6, 4)) |> set_columnLabels( c("Tip", "Total Bill", "Time of Day", "Smoker")) |> set_mapping(aes(color = time)) |> set_mapping(aes(color = time, alpha = I(.7))) |> # Matrix Sections set_lower(list(continuous = "smooth", combo = "facetdensity", discrete = "crosstable", mapping = aes(color = NULL))) ``` ] .panel2-the_chunk-auto[ <!-- --> ] --- count: false .panel1-the_chunk-auto[ ``` r ggpairs_piped(tips) |> # simple start univariate plots # to ggpairs - pairwise plots set_lower() |> set_upper() |> # Columns and Mapping set_columns(c("tip", "total_bill", "time", "smoker")) |> set_columns(c( 2, 1, 6, 4)) |> set_columnLabels( c("Tip", "Total Bill", "Time of Day", "Smoker")) |> set_mapping(aes(color = time)) |> set_mapping(aes(color = time, alpha = I(.7))) |> # Matrix Sections set_lower(list(continuous = "smooth", combo = "facetdensity", discrete = "crosstable", mapping = aes(color = NULL))) |> set_upper("blank") ``` ] .panel2-the_chunk-auto[ <!-- --> ] --- count: false .panel1-the_chunk-auto[ ``` r ggpairs_piped(tips) |> # simple start univariate plots # to ggpairs - pairwise plots set_lower() |> set_upper() |> # Columns and Mapping set_columns(c("tip", "total_bill", "time", "smoker")) |> set_columns(c( 2, 1, 6, 4)) |> set_columnLabels( c("Tip", "Total Bill", "Time of Day", "Smoker")) |> set_mapping(aes(color = time)) |> set_mapping(aes(color = time, alpha = I(.7))) |> # Matrix Sections set_lower(list(continuous = "smooth", combo = "facetdensity", discrete = "crosstable", mapping = aes(color = NULL))) |> set_upper("blank") |> set_diag("blank") ``` ] .panel2-the_chunk-auto[ <!-- --> ] --- count: false .panel1-the_chunk-auto[ ``` r ggpairs_piped(tips) |> # simple start univariate plots # to ggpairs - pairwise plots set_lower() |> set_upper() |> # Columns and Mapping set_columns(c("tip", "total_bill", "time", "smoker")) |> set_columns(c( 2, 1, 6, 4)) |> set_columnLabels( c("Tip", "Total Bill", "Time of Day", "Smoker")) |> set_mapping(aes(color = time)) |> set_mapping(aes(color = time, alpha = I(.7))) |> # Matrix Sections set_lower(list(continuous = "smooth", combo = "facetdensity", discrete = "crosstable", mapping = aes(color = NULL))) |> set_upper("blank") |> set_diag("blank") |> collect() ``` ] .panel2-the_chunk-auto[ <!-- --> ] --- count: false .panel1-the_chunk-auto[ ``` r ggpairs_piped(tips) |> # simple start univariate plots # to ggpairs - pairwise plots set_lower() |> set_upper() |> # Columns and Mapping set_columns(c("tip", "total_bill", "time", "smoker")) |> set_columns(c( 2, 1, 6, 4)) |> set_columnLabels( c("Tip", "Total Bill", "Time of Day", "Smoker")) |> set_mapping(aes(color = time)) |> set_mapping(aes(color = time, alpha = I(.7))) |> # Matrix Sections set_lower(list(continuous = "smooth", combo = "facetdensity", discrete = "crosstable", mapping = aes(color = NULL))) |> set_upper("blank") |> set_diag("blank") |> collect() -> pairs ``` ] .panel2-the_chunk-auto[ ] --- count: false .panel1-the_chunk-auto[ ``` r ggpairs_piped(tips) |> # simple start univariate plots # to ggpairs - pairwise plots set_lower() |> set_upper() |> # Columns and Mapping set_columns(c("tip", "total_bill", "time", "smoker")) |> set_columns(c( 2, 1, 6, 4)) |> set_columnLabels( c("Tip", "Total Bill", "Time of Day", "Smoker")) |> set_mapping(aes(color = time)) |> set_mapping(aes(color = time, alpha = I(.7))) |> # Matrix Sections set_lower(list(continuous = "smooth", combo = "facetdensity", discrete = "crosstable", mapping = aes(color = NULL))) |> set_upper("blank") |> set_diag("blank") |> collect() -> pairs pairs[2, 1] ``` ] .panel2-the_chunk-auto[ <!-- --> ] --- count: false .panel1-the_chunk-auto[ ``` r ggpairs_piped(tips) |> # simple start univariate plots # to ggpairs - pairwise plots set_lower() |> set_upper() |> # Columns and Mapping set_columns(c("tip", "total_bill", "time", "smoker")) |> set_columns(c( 2, 1, 6, 4)) |> set_columnLabels( c("Tip", "Total Bill", "Time of Day", "Smoker")) |> set_mapping(aes(color = time)) |> set_mapping(aes(color = time, alpha = I(.7))) |> # Matrix Sections set_lower(list(continuous = "smooth", combo = "facetdensity", discrete = "crosstable", mapping = aes(color = NULL))) |> set_upper("blank") |> set_diag("blank") |> collect() -> pairs pairs[2, 1] + theme_dark() ``` ] .panel2-the_chunk-auto[ <!-- --> ] --- count: false .panel1-the_chunk-auto[ ``` r ggpairs_piped(tips) |> # simple start univariate plots # to ggpairs - pairwise plots set_lower() |> set_upper() |> # Columns and Mapping set_columns(c("tip", "total_bill", "time", "smoker")) |> set_columns(c( 2, 1, 6, 4)) |> set_columnLabels( c("Tip", "Total Bill", "Time of Day", "Smoker")) |> set_mapping(aes(color = time)) |> set_mapping(aes(color = time, alpha = I(.7))) |> # Matrix Sections set_lower(list(continuous = "smooth", combo = "facetdensity", discrete = "crosstable", mapping = aes(color = NULL))) |> set_upper("blank") |> set_diag("blank") |> collect() -> pairs pairs[2, 1] + theme_dark() -> pairs[2, 1] ``` ] .panel2-the_chunk-auto[ ] --- count: false .panel1-the_chunk-auto[ ``` r ggpairs_piped(tips) |> # simple start univariate plots # to ggpairs - pairwise plots set_lower() |> set_upper() |> # Columns and Mapping set_columns(c("tip", "total_bill", "time", "smoker")) |> set_columns(c( 2, 1, 6, 4)) |> set_columnLabels( c("Tip", "Total Bill", "Time of Day", "Smoker")) |> set_mapping(aes(color = time)) |> set_mapping(aes(color = time, alpha = I(.7))) |> # Matrix Sections set_lower(list(continuous = "smooth", combo = "facetdensity", discrete = "crosstable", mapping = aes(color = NULL))) |> set_upper("blank") |> set_diag("blank") |> collect() -> pairs pairs[2, 1] + theme_dark() -> pairs[2, 1] pairs ``` ] .panel2-the_chunk-auto[ <!-- --> ] <style> .panel1-the_chunk-auto { color: black; width: 38.6060606060606%; hight: 32%; float: left; padding-left: 1%; font-size: 80% } .panel2-the_chunk-auto { color: black; width: 59.3939393939394%; hight: 32%; float: left; padding-left: 1%; font-size: 80% } .panel3-the_chunk-auto { color: black; width: NA%; hight: 33%; float: left; padding-left: 1%; font-size: 80% } </style> <style type="text/css"> .remark-code{line-height: 1.5; font-size: 80%} @media print { .has-continuation { display: block; } } code.r.hljs.remark-code{ position: relative; overflow-x: hidden; } code.r.hljs.remark-code:hover{ overflow-x:visible; width: 500px; border-style: solid; } </style>