class: inverse, bottom background-image: url(https://images.unsplash.com/photo-1559827260-dc66d52bef19?ixlib=rb-4.0.3&ixid=M3wxMjA3fDB8MHxwaG90by1wYWdlfHx8fGVufDB8fHx8fA%3D%3D&auto=format&fit=crop&w=1470&q=80) background-size: cover # .Large[Data Science for IR: Introductions] ## .small[Korbel School of International Studies] ## .small[bit.ly/spring-2026-du] #### .tiny[Dr. Evangeline Reynolds | 2026-03-30 | DU, Image credit: Silas Baisch, Upsplash] ??? Title slide # Hi! ``` r us_states_ref <- usmapdata::us_map() |> rename(geometry = geom, state_name = full, state_abbr = abbr) |> select(state_name, everything()) library(ggregions) geom_us_state <- write_geom_region_locale(us_states_ref) stamp_us_state <- write_stamp_region_locale(us_states_ref) geom_us_state_text <- write_geom_region_text_locale(us_states_ref) stamp_us_states_text <- write_stamp_region_text_locale(us_states_ref) ``` --- count: false .panel1-us-auto[ ``` r *tribble(~state, ~span, * "Illinois", .6, * "Virginia", .1 , * "Colorado", .4, * "New York", .15) ``` ] .panel2-us-auto[ ``` # A tibble: 4 × 2 state span <chr> <dbl> 1 Illinois 0.6 2 Virginia 0.1 3 Colorado 0.4 4 New York 0.15 ``` ] --- count: false .panel1-us-auto[ ``` r tribble(~state, ~span, "Illinois", .6, "Virginia", .1 , "Colorado", .4, "New York", .15) |> * ggplot() ``` ] .panel2-us-auto[ <!-- --> ] --- count: false .panel1-us-auto[ ``` r tribble(~state, ~span, "Illinois", .6, "Virginia", .1 , "Colorado", .4, "New York", .15) |> ggplot() + * aes(state_name = state, * fill = span) ``` ] .panel2-us-auto[ <!-- --> ] --- count: false .panel1-us-auto[ ``` r tribble(~state, ~span, "Illinois", .6, "Virginia", .1 , "Colorado", .4, "New York", .15) |> ggplot() + aes(state_name = state, fill = span) + * stamp_us_state() ``` ] .panel2-us-auto[ <!-- --> ] --- count: false .panel1-us-auto[ ``` r tribble(~state, ~span, "Illinois", .6, "Virginia", .1 , "Colorado", .4, "New York", .15) |> ggplot() + aes(state_name = state, fill = span) + stamp_us_state() + * geom_us_state() ``` ] .panel2-us-auto[ <!-- --> ] --- count: false .panel1-us-auto[ ``` r tribble(~state, ~span, "Illinois", .6, "Virginia", .1 , "Colorado", .4, "New York", .15) |> ggplot() + aes(state_name = state, fill = span) + stamp_us_state() + geom_us_state() + * scale_fill_viridis_c() ``` ] .panel2-us-auto[ <!-- --> ] --- count: false .panel1-us-auto[ ``` r tribble(~state, ~span, "Illinois", .6, "Virginia", .1 , "Colorado", .4, "New York", .15) |> ggplot() + aes(state_name = state, fill = span) + stamp_us_state() + geom_us_state() + scale_fill_viridis_c() + * scale_fill_viridis_c(end = .8, * begin = .3) ``` ] .panel2-us-auto[ <!-- --> ] <style> .panel1-us-auto { color: black; width: 38.6060606060606%; hight: 32%; float: left; padding-left: 1%; font-size: 80% } .panel2-us-auto { color: black; width: 59.3939393939394%; hight: 32%; float: left; padding-left: 1%; font-size: 80% } .panel3-us-auto { color: black; width: NA%; hight: 33%; float: left; padding-left: 1%; font-size: 80% } </style> --- ``` r library(rnaturalearth) natural_earth_ref <- rnaturalearth::ne_countries(scale = "small") |> select(country_name = name_en, iso3c = iso_a3) library(ggregions) geom_country <- write_geom_region_locale(natural_earth_ref) stamp_country <- write_stamp_region_locale(natural_earth_ref) geom_country_text <- write_geom_region_text_locale(natural_earth_ref) stamp_country_text <- write_stamp_region_text_locale(natural_earth_ref) ``` --- count: false .panel1-world-auto[ ``` r *tribble(~state, ~time_span, * "United States of America", 4, * "Germany", 2 , * "Brazil", 2, * "Argentina", 2) ``` ] .panel2-world-auto[ ``` # A tibble: 4 × 2 state time_span <chr> <dbl> 1 United States of America 4 2 Germany 2 3 Brazil 2 4 Argentina 2 ``` ] --- count: false .panel1-world-auto[ ``` r tribble(~state, ~time_span, "United States of America", 4, "Germany", 2 , "Brazil", 2, "Argentina", 2) |> * ggplot() ``` ] .panel2-world-auto[ <!-- --> ] --- count: false .panel1-world-auto[ ``` r tribble(~state, ~time_span, "United States of America", 4, "Germany", 2 , "Brazil", 2, "Argentina", 2) |> ggplot() + * aes(country_name = state) ``` ] .panel2-world-auto[ <!-- --> ] --- count: false .panel1-world-auto[ ``` r tribble(~state, ~time_span, "United States of America", 4, "Germany", 2 , "Brazil", 2, "Argentina", 2) |> ggplot() + aes(country_name = state) + * stamp_country(drop = "Antarctica") ``` ] .panel2-world-auto[ <!-- --> ] --- count: false .panel1-world-auto[ ``` r tribble(~state, ~time_span, "United States of America", 4, "Germany", 2 , "Brazil", 2, "Argentina", 2) |> ggplot() + aes(country_name = state) + stamp_country(drop = "Antarctica") + * geom_country() ``` ] .panel2-world-auto[ <!-- --> ] --- count: false .panel1-world-auto[ ``` r tribble(~state, ~time_span, "United States of America", 4, "Germany", 2 , "Brazil", 2, "Argentina", 2) |> ggplot() + aes(country_name = state) + stamp_country(drop = "Antarctica") + geom_country() + * aes(fill = time_span) ``` ] .panel2-world-auto[ <!-- --> ] <style> .panel1-world-auto { color: black; width: 38.6060606060606%; hight: 32%; float: left; padding-left: 1%; font-size: 80% } .panel2-world-auto { color: black; width: 59.3939393939394%; hight: 32%; float: left; padding-left: 1%; font-size: 80% } .panel3-world-auto { color: black; width: NA%; hight: 33%; float: left; padding-left: 1%; font-size: 80% } </style> --- count: false .panel1-tidyverse-auto[ ``` r *library(tidyverse) ``` ] .panel2-tidyverse-auto[ ] --- count: false .panel1-tidyverse-auto[ ``` r library(tidyverse) *library(ggraph) ``` ] .panel2-tidyverse-auto[ ] --- count: false .panel1-tidyverse-auto[ ``` r library(tidyverse) library(ggraph) # data cleaning *as_tibble(tools::CRAN_package_db()) ``` ] .panel2-tidyverse-auto[ ``` # A tibble: 23,483 × 69 Package Version Priority Depends Imports LinkingTo Suggests Enhances License <chr> <chr> <chr> <chr> <chr> <chr> <chr> <chr> <chr> 1 a5R 0.3.1 <NA> R (>= … cli, r… <NA> "arrow,… <NA> Apache… 2 aae.pop 0.2.0 <NA> R (>= … stats,… <NA> "knitr,… <NA> Apache… 3 AalenJo… 1.0 <NA> <NA> <NA> <NA> "knitr,… <NA> GPL (>… 4 aamatch 0.4.5 <NA> R (>= … iTOS, … <NA> "DOS2, … <NA> GPL-2 5 AATtools 0.0.3 <NA> R (>= … magrit… <NA> <NA> <NA> GPL-3 6 ABACUS 1.0.0 <NA> R (>= … ggplot… <NA> "rmarkd… <NA> GPL-3 7 abasequ… 0.1.0 <NA> <NA> <NA> <NA> <NA> <NA> GPL-3 8 abbrevi… 0.1 <NA> <NA> <NA> <NA> "testth… <NA> GPL-3 9 abc 2.2.2 <NA> R (>= … <NA> <NA> <NA> <NA> GPL (>… 10 abc.data 1.1 <NA> R (>= … <NA> <NA> <NA> <NA> GPL (>… # ℹ 23,473 more rows # ℹ 60 more variables: License_is_FOSS <chr>, License_restricts_use <chr>, # OS_type <chr>, Archs <chr>, MD5sum <chr>, NeedsCompilation <chr>, # Additional_repositories <chr>, Author <chr>, `Authors@R` <chr>, # Biarch <chr>, BugReports <chr>, BuildKeepEmpty <chr>, BuildManual <chr>, # BuildResaveData <chr>, BuildVignettes <chr>, Built <chr>, # ByteCompile <chr>, `Classification/ACM` <chr>, … ``` ] --- count: false .panel1-tidyverse-auto[ ``` r library(tidyverse) library(ggraph) # data cleaning as_tibble(tools::CRAN_package_db()) |> * filter(Package %in% c("dplyr", "ggplot2", "ellmer", * "tidyr", "tidymodels", "recipes", * "readr", "tibble", "stringr", "forcats", * "purrr", "lubridate")) ``` ] .panel2-tidyverse-auto[ ``` # A tibble: 12 × 69 Package Version Priority Depends Imports LinkingTo Suggests Enhances License <chr> <chr> <chr> <chr> <chr> <chr> <chr> <chr> <chr> 1 dplyr 1.2.0 <NA> R (>= … "cli (… <NA> "broom,… <NA> MIT + … 2 ellmer 0.4.0 <NA> R (>= … "cli, … <NA> "connec… <NA> MIT + … 3 forcats 1.0.1 <NA> R (>= … "cli (… <NA> "covr, … <NA> MIT + … 4 ggplot2 4.0.2 <NA> R (>= … "cli, … <NA> "broom,… sp MIT + … 5 lubrida… 1.9.5 <NA> method… "gener… <NA> "covr, … chron, … MIT + … 6 purrr 1.2.1 <NA> R (>= … "cli (… cli "carrie… <NA> MIT + … 7 readr 2.2.0 <NA> R (>= … "cli, … cpp11, t… "covr, … <NA> MIT + … 8 recipes 1.3.1 <NA> dplyr … "cli, … <NA> "covr, … <NA> MIT + … 9 stringr 1.6.0 <NA> R (>= … "cli, … <NA> "covr, … <NA> MIT + … 10 tibble 3.3.1 <NA> R (>= … "cli, … <NA> "bench,… <NA> MIT + … 11 tidymod… 1.4.1 <NA> R (>= … "broom… <NA> "covr, … <NA> MIT + … 12 tidyr 1.3.2 <NA> R (>= … "cli (… cpp11 (>… "covr, … <NA> MIT + … # ℹ 60 more variables: License_is_FOSS <chr>, License_restricts_use <chr>, # OS_type <chr>, Archs <chr>, MD5sum <chr>, NeedsCompilation <chr>, # Additional_repositories <chr>, Author <chr>, `Authors@R` <chr>, # Biarch <chr>, BugReports <chr>, BuildKeepEmpty <chr>, BuildManual <chr>, # BuildResaveData <chr>, BuildVignettes <chr>, Built <chr>, # ByteCompile <chr>, `Classification/ACM` <chr>, # `Classification/ACM-2012` <chr>, `Classification/JEL` <chr>, … ``` ] --- count: false .panel1-tidyverse-auto[ ``` r library(tidyverse) library(ggraph) # data cleaning as_tibble(tools::CRAN_package_db()) |> filter(Package %in% c("dplyr", "ggplot2", "ellmer", "tidyr", "tidymodels", "recipes", "readr", "tibble", "stringr", "forcats", "purrr", "lubridate")) |> * mutate(Author = str_replace_all(Author, ' \\[|\\]', "*" )) ``` ] .panel2-tidyverse-auto[ ``` # A tibble: 12 × 69 Package Version Priority Depends Imports LinkingTo Suggests Enhances License <chr> <chr> <chr> <chr> <chr> <chr> <chr> <chr> <chr> 1 dplyr 1.2.0 <NA> R (>= … "cli (… <NA> "broom,… <NA> MIT + … 2 ellmer 0.4.0 <NA> R (>= … "cli, … <NA> "connec… <NA> MIT + … 3 forcats 1.0.1 <NA> R (>= … "cli (… <NA> "covr, … <NA> MIT + … 4 ggplot2 4.0.2 <NA> R (>= … "cli, … <NA> "broom,… sp MIT + … 5 lubrida… 1.9.5 <NA> method… "gener… <NA> "covr, … chron, … MIT + … 6 purrr 1.2.1 <NA> R (>= … "cli (… cli "carrie… <NA> MIT + … 7 readr 2.2.0 <NA> R (>= … "cli, … cpp11, t… "covr, … <NA> MIT + … 8 recipes 1.3.1 <NA> dplyr … "cli, … <NA> "covr, … <NA> MIT + … 9 stringr 1.6.0 <NA> R (>= … "cli, … <NA> "covr, … <NA> MIT + … 10 tibble 3.3.1 <NA> R (>= … "cli, … <NA> "bench,… <NA> MIT + … 11 tidymod… 1.4.1 <NA> R (>= … "broom… <NA> "covr, … <NA> MIT + … 12 tidyr 1.3.2 <NA> R (>= … "cli (… cpp11 (>… "covr, … <NA> MIT + … # ℹ 60 more variables: License_is_FOSS <chr>, License_restricts_use <chr>, # OS_type <chr>, Archs <chr>, MD5sum <chr>, NeedsCompilation <chr>, # Additional_repositories <chr>, Author <chr>, `Authors@R` <chr>, # Biarch <chr>, BugReports <chr>, BuildKeepEmpty <chr>, BuildManual <chr>, # BuildResaveData <chr>, BuildVignettes <chr>, Built <chr>, # ByteCompile <chr>, `Classification/ACM` <chr>, # `Classification/ACM-2012` <chr>, `Classification/JEL` <chr>, … ``` ] --- count: false .panel1-tidyverse-auto[ ``` r library(tidyverse) library(ggraph) # data cleaning as_tibble(tools::CRAN_package_db()) |> filter(Package %in% c("dplyr", "ggplot2", "ellmer", "tidyr", "tidymodels", "recipes", "readr", "tibble", "stringr", "forcats", "purrr", "lubridate")) |> mutate(Author = str_replace_all(Author, ' \\[|\\]', "*" )) |> * select(Package, Author) ``` ] .panel2-tidyverse-auto[ ``` # A tibble: 12 × 2 Package Author <chr> <chr> 1 dplyr "Hadley Wickham*aut, cre* (ORCID:\n <https://orcid.org/0000-00… 2 ellmer "Hadley Wickham*aut, cre* (ORCID:\n <https://orcid.org/0000-00… 3 forcats "Hadley Wickham*aut, cre*,\n Posit Software, PBC*cph, fnd* (ROR:… 4 ggplot2 "Hadley Wickham*aut* (ORCID: <https://orcid.org/0000-0003-4757-11… 5 lubridate "Vitalie Spinu*aut, cre*,\n Garrett Grolemund*aut*,\n Hadley Wi… 6 purrr "Hadley Wickham*aut, cre* (ORCID:\n <https://orcid.org/0000-00… 7 readr "Hadley Wickham*aut*,\n Jim Hester*aut*,\n Romain Francois*ctb*… 8 recipes "Max Kuhn*aut, cre*,\n Hadley Wickham*aut*,\n Emil Hvitfeldt*au… 9 stringr "Hadley Wickham*aut, cre, cph*,\n Posit Software, PBC*cph, fnd*" 10 tibble "Kirill Müller*aut, cre* (ORCID:\n <https://orcid.org/0000-000… 11 tidymodels "Max Kuhn*aut, cre* (ORCID: <https://orcid.org/0000-0003-2402-136… 12 tidyr "Hadley Wickham*aut, cre*,\n Davis Vaughan*aut*,\n Maximilian G… ``` ] --- count: false .panel1-tidyverse-auto[ ``` r library(tidyverse) library(ggraph) # data cleaning as_tibble(tools::CRAN_package_db()) |> filter(Package %in% c("dplyr", "ggplot2", "ellmer", "tidyr", "tidymodels", "recipes", "readr", "tibble", "stringr", "forcats", "purrr", "lubridate")) |> mutate(Author = str_replace_all(Author, ' \\[|\\]', "*" )) |> select(Package, Author) |> * mutate(Author = map(Author, ~ str_split_1(.x,"\n"))) ``` ] .panel2-tidyverse-auto[ ``` # A tibble: 12 × 2 Package Author <chr> <list> 1 dplyr <chr [7]> 2 ellmer <chr [8]> 3 forcats <chr [2]> 4 ggplot2 <chr [13]> 5 lubridate <chr [11]> 6 purrr <chr [4]> 7 readr <chr [10]> 8 recipes <chr [4]> 9 stringr <chr [2]> 10 tibble <chr [6]> 11 tidymodels <chr [3]> 12 tidyr <chr [5]> ``` ] --- count: false .panel1-tidyverse-auto[ ``` r library(tidyverse) library(ggraph) # data cleaning as_tibble(tools::CRAN_package_db()) |> filter(Package %in% c("dplyr", "ggplot2", "ellmer", "tidyr", "tidymodels", "recipes", "readr", "tibble", "stringr", "forcats", "purrr", "lubridate")) |> mutate(Author = str_replace_all(Author, ' \\[|\\]', "*" )) |> select(Package, Author) |> mutate(Author = map(Author, ~ str_split_1(.x,"\n"))) |> * unnest() ``` ] .panel2-tidyverse-auto[ ``` # A tibble: 75 × 2 Package Author <chr> <chr> 1 dplyr "Hadley Wickham*aut, cre* (ORCID:" 2 dplyr " <https://orcid.org/0000-0003-4757-117X>)," 3 dplyr " Romain François*aut* (ORCID: <https://orcid.org/0000-0002-2444-42… 4 dplyr " Lionel Henry*aut*," 5 dplyr " Kirill Müller*aut* (ORCID: <https://orcid.org/0000-0002-1416-3412… 6 dplyr " Davis Vaughan*aut* (ORCID: <https://orcid.org/0000-0003-4777-038X… 7 dplyr " Posit Software, PBC*cph, fnd*" 8 ellmer "Hadley Wickham*aut, cre* (ORCID:" 9 ellmer " <https://orcid.org/0000-0003-4757-117X>)," 10 ellmer " Joe Cheng*aut*," # ℹ 65 more rows ``` ] --- count: false .panel1-tidyverse-auto[ ``` r library(tidyverse) library(ggraph) # data cleaning as_tibble(tools::CRAN_package_db()) |> filter(Package %in% c("dplyr", "ggplot2", "ellmer", "tidyr", "tidymodels", "recipes", "readr", "tibble", "stringr", "forcats", "purrr", "lubridate")) |> mutate(Author = str_replace_all(Author, ' \\[|\\]', "*" )) |> select(Package, Author) |> mutate(Author = map(Author, ~ str_split_1(.x,"\n"))) |> unnest() |> * mutate(Author = Author |> str_remove('\\*.+' )) ``` ] .panel2-tidyverse-auto[ ``` # A tibble: 75 × 2 Package Author <chr> <chr> 1 dplyr "Hadley Wickham" 2 dplyr " <https://orcid.org/0000-0003-4757-117X>)," 3 dplyr " Romain François" 4 dplyr " Lionel Henry" 5 dplyr " Kirill Müller" 6 dplyr " Davis Vaughan" 7 dplyr " Posit Software, PBC" 8 ellmer "Hadley Wickham" 9 ellmer " <https://orcid.org/0000-0003-4757-117X>)," 10 ellmer " Joe Cheng" # ℹ 65 more rows ``` ] --- count: false .panel1-tidyverse-auto[ ``` r library(tidyverse) library(ggraph) # data cleaning as_tibble(tools::CRAN_package_db()) |> filter(Package %in% c("dplyr", "ggplot2", "ellmer", "tidyr", "tidymodels", "recipes", "readr", "tibble", "stringr", "forcats", "purrr", "lubridate")) |> mutate(Author = str_replace_all(Author, ' \\[|\\]', "*" )) |> select(Package, Author) |> mutate(Author = map(Author, ~ str_split_1(.x,"\n"))) |> unnest() |> mutate(Author = Author |> str_remove('\\*.+' )) |> * mutate(Author = Author |> str_trim()) ``` ] .panel2-tidyverse-auto[ ``` # A tibble: 75 × 2 Package Author <chr> <chr> 1 dplyr Hadley Wickham 2 dplyr <https://orcid.org/0000-0003-4757-117X>), 3 dplyr Romain François 4 dplyr Lionel Henry 5 dplyr Kirill Müller 6 dplyr Davis Vaughan 7 dplyr Posit Software, PBC 8 ellmer Hadley Wickham 9 ellmer <https://orcid.org/0000-0003-4757-117X>), 10 ellmer Joe Cheng # ℹ 65 more rows ``` ] --- count: false .panel1-tidyverse-auto[ ``` r library(tidyverse) library(ggraph) # data cleaning as_tibble(tools::CRAN_package_db()) |> filter(Package %in% c("dplyr", "ggplot2", "ellmer", "tidyr", "tidymodels", "recipes", "readr", "tibble", "stringr", "forcats", "purrr", "lubridate")) |> mutate(Author = str_replace_all(Author, ' \\[|\\]', "*" )) |> select(Package, Author) |> mutate(Author = map(Author, ~ str_split_1(.x,"\n"))) |> unnest() |> mutate(Author = Author |> str_remove('\\*.+' )) |> mutate(Author = Author |> str_trim()) |> * filter_out(Author |> str_detect("orcid.org")) ``` ] .panel2-tidyverse-auto[ ``` # A tibble: 67 × 2 Package Author <chr> <chr> 1 dplyr Hadley Wickham 2 dplyr Romain François 3 dplyr Lionel Henry 4 dplyr Kirill Müller 5 dplyr Davis Vaughan 6 dplyr Posit Software, PBC 7 ellmer Hadley Wickham 8 ellmer Joe Cheng 9 ellmer Aaron Jacobs 10 ellmer Garrick Aden-Buie # ℹ 57 more rows ``` ] --- count: false .panel1-tidyverse-auto[ ``` r library(tidyverse) library(ggraph) # data cleaning as_tibble(tools::CRAN_package_db()) |> filter(Package %in% c("dplyr", "ggplot2", "ellmer", "tidyr", "tidymodels", "recipes", "readr", "tibble", "stringr", "forcats", "purrr", "lubridate")) |> mutate(Author = str_replace_all(Author, ' \\[|\\]', "*" )) |> select(Package, Author) |> mutate(Author = map(Author, ~ str_split_1(.x,"\n"))) |> unnest() |> mutate(Author = Author |> str_remove('\\*.+' )) |> mutate(Author = Author |> str_trim()) |> filter_out(Author |> str_detect("orcid.org")) |> * filter_out(Author == "Posit Software, PBC") ``` ] .panel2-tidyverse-auto[ ``` # A tibble: 57 × 2 Package Author <chr> <chr> 1 dplyr Hadley Wickham 2 dplyr Romain François 3 dplyr Lionel Henry 4 dplyr Kirill Müller 5 dplyr Davis Vaughan 6 ellmer Hadley Wickham 7 ellmer Joe Cheng 8 ellmer Aaron Jacobs 9 ellmer Garrick Aden-Buie 10 ellmer Barret Schloerke # ℹ 47 more rows ``` ] --- count: false .panel1-tidyverse-auto[ ``` r library(tidyverse) library(ggraph) # data cleaning as_tibble(tools::CRAN_package_db()) |> filter(Package %in% c("dplyr", "ggplot2", "ellmer", "tidyr", "tidymodels", "recipes", "readr", "tibble", "stringr", "forcats", "purrr", "lubridate")) |> mutate(Author = str_replace_all(Author, ' \\[|\\]', "*" )) |> select(Package, Author) |> mutate(Author = map(Author, ~ str_split_1(.x,"\n"))) |> unnest() |> mutate(Author = Author |> str_remove('\\*.+' )) |> mutate(Author = Author |> str_trim()) |> filter_out(Author |> str_detect("orcid.org")) |> filter_out(Author == "Posit Software, PBC") |> * filter_out(Author == "Posit, PBC") ``` ] .panel2-tidyverse-auto[ ``` # A tibble: 56 × 2 Package Author <chr> <chr> 1 dplyr Hadley Wickham 2 dplyr Romain François 3 dplyr Lionel Henry 4 dplyr Kirill Müller 5 dplyr Davis Vaughan 6 ellmer Hadley Wickham 7 ellmer Joe Cheng 8 ellmer Aaron Jacobs 9 ellmer Garrick Aden-Buie 10 ellmer Barret Schloerke # ℹ 46 more rows ``` ] --- count: false .panel1-tidyverse-auto[ ``` r library(tidyverse) library(ggraph) # data cleaning as_tibble(tools::CRAN_package_db()) |> filter(Package %in% c("dplyr", "ggplot2", "ellmer", "tidyr", "tidymodels", "recipes", "readr", "tibble", "stringr", "forcats", "purrr", "lubridate")) |> mutate(Author = str_replace_all(Author, ' \\[|\\]', "*" )) |> select(Package, Author) |> mutate(Author = map(Author, ~ str_split_1(.x,"\n"))) |> unnest() |> mutate(Author = Author |> str_remove('\\*.+' )) |> mutate(Author = Author |> str_trim()) |> filter_out(Author |> str_detect("orcid.org")) |> filter_out(Author == "Posit Software, PBC") |> filter_out(Author == "Posit, PBC") -> *package_author_data ``` ] .panel2-tidyverse-auto[ ] --- count: false .panel1-tidyverse-auto[ ``` r library(tidyverse) library(ggraph) # data cleaning as_tibble(tools::CRAN_package_db()) |> filter(Package %in% c("dplyr", "ggplot2", "ellmer", "tidyr", "tidymodels", "recipes", "readr", "tibble", "stringr", "forcats", "purrr", "lubridate")) |> mutate(Author = str_replace_all(Author, ' \\[|\\]', "*" )) |> select(Package, Author) |> mutate(Author = map(Author, ~ str_split_1(.x,"\n"))) |> unnest() |> mutate(Author = Author |> str_remove('\\*.+' )) |> mutate(Author = Author |> str_trim()) |> filter_out(Author |> str_detect("orcid.org")) |> filter_out(Author == "Posit Software, PBC") |> filter_out(Author == "Posit, PBC") -> package_author_data # network visualization *package_author_data ``` ] .panel2-tidyverse-auto[ ``` # A tibble: 56 × 2 Package Author <chr> <chr> 1 dplyr Hadley Wickham 2 dplyr Romain François 3 dplyr Lionel Henry 4 dplyr Kirill Müller 5 dplyr Davis Vaughan 6 ellmer Hadley Wickham 7 ellmer Joe Cheng 8 ellmer Aaron Jacobs 9 ellmer Garrick Aden-Buie 10 ellmer Barret Schloerke # ℹ 46 more rows ``` ] --- count: false .panel1-tidyverse-auto[ ``` r library(tidyverse) library(ggraph) # data cleaning as_tibble(tools::CRAN_package_db()) |> filter(Package %in% c("dplyr", "ggplot2", "ellmer", "tidyr", "tidymodels", "recipes", "readr", "tibble", "stringr", "forcats", "purrr", "lubridate")) |> mutate(Author = str_replace_all(Author, ' \\[|\\]', "*" )) |> select(Package, Author) |> mutate(Author = map(Author, ~ str_split_1(.x,"\n"))) |> unnest() |> mutate(Author = Author |> str_remove('\\*.+' )) |> mutate(Author = Author |> str_trim()) |> filter_out(Author |> str_detect("orcid.org")) |> filter_out(Author == "Posit Software, PBC") |> filter_out(Author == "Posit, PBC") -> package_author_data # network visualization package_author_data |> * ggraph(layout = "kk") ``` ] .panel2-tidyverse-auto[ <!-- --> ] --- count: false .panel1-tidyverse-auto[ ``` r library(tidyverse) library(ggraph) # data cleaning as_tibble(tools::CRAN_package_db()) |> filter(Package %in% c("dplyr", "ggplot2", "ellmer", "tidyr", "tidymodels", "recipes", "readr", "tibble", "stringr", "forcats", "purrr", "lubridate")) |> mutate(Author = str_replace_all(Author, ' \\[|\\]', "*" )) |> select(Package, Author) |> mutate(Author = map(Author, ~ str_split_1(.x,"\n"))) |> unnest() |> mutate(Author = Author |> str_remove('\\*.+' )) |> mutate(Author = Author |> str_trim()) |> filter_out(Author |> str_detect("orcid.org")) |> filter_out(Author == "Posit Software, PBC") |> filter_out(Author == "Posit, PBC") -> package_author_data # network visualization package_author_data |> ggraph(layout = "kk") + * geom_edge_link() ``` ] .panel2-tidyverse-auto[ <!-- --> ] --- count: false .panel1-tidyverse-auto[ ``` r library(tidyverse) library(ggraph) # data cleaning as_tibble(tools::CRAN_package_db()) |> filter(Package %in% c("dplyr", "ggplot2", "ellmer", "tidyr", "tidymodels", "recipes", "readr", "tibble", "stringr", "forcats", "purrr", "lubridate")) |> mutate(Author = str_replace_all(Author, ' \\[|\\]', "*" )) |> select(Package, Author) |> mutate(Author = map(Author, ~ str_split_1(.x,"\n"))) |> unnest() |> mutate(Author = Author |> str_remove('\\*.+' )) |> mutate(Author = Author |> str_trim()) |> filter_out(Author |> str_detect("orcid.org")) |> filter_out(Author == "Posit Software, PBC") |> filter_out(Author == "Posit, PBC") -> package_author_data # network visualization package_author_data |> ggraph(layout = "kk") + geom_edge_link() + * geom_node_point() ``` ] .panel2-tidyverse-auto[ 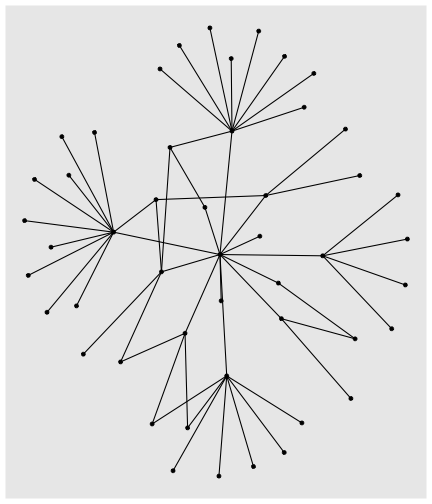<!-- --> ] --- count: false .panel1-tidyverse-auto[ ``` r library(tidyverse) library(ggraph) # data cleaning as_tibble(tools::CRAN_package_db()) |> filter(Package %in% c("dplyr", "ggplot2", "ellmer", "tidyr", "tidymodels", "recipes", "readr", "tibble", "stringr", "forcats", "purrr", "lubridate")) |> mutate(Author = str_replace_all(Author, ' \\[|\\]', "*" )) |> select(Package, Author) |> mutate(Author = map(Author, ~ str_split_1(.x,"\n"))) |> unnest() |> mutate(Author = Author |> str_remove('\\*.+' )) |> mutate(Author = Author |> str_trim()) |> filter_out(Author |> str_detect("orcid.org")) |> filter_out(Author == "Posit Software, PBC") |> filter_out(Author == "Posit, PBC") -> package_author_data # network visualization package_author_data |> ggraph(layout = "kk") + geom_edge_link() + geom_node_point() + * geom_node_label(aes(label = name)) ``` ] .panel2-tidyverse-auto[ 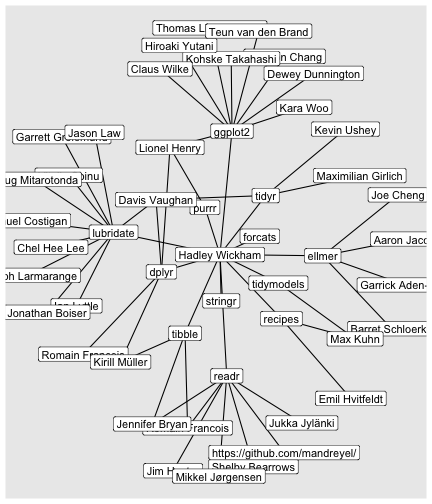<!-- --> ] --- count: false .panel1-tidyverse-auto[ ``` r library(tidyverse) library(ggraph) # data cleaning as_tibble(tools::CRAN_package_db()) |> filter(Package %in% c("dplyr", "ggplot2", "ellmer", "tidyr", "tidymodels", "recipes", "readr", "tibble", "stringr", "forcats", "purrr", "lubridate")) |> mutate(Author = str_replace_all(Author, ' \\[|\\]', "*" )) |> select(Package, Author) |> mutate(Author = map(Author, ~ str_split_1(.x,"\n"))) |> unnest() |> mutate(Author = Author |> str_remove('\\*.+' )) |> mutate(Author = Author |> str_trim()) |> filter_out(Author |> str_detect("orcid.org")) |> filter_out(Author == "Posit Software, PBC") |> filter_out(Author == "Posit, PBC") -> package_author_data # network visualization package_author_data |> ggraph(layout = "kk") + geom_edge_link() + geom_node_point() + geom_node_label(aes(label = name)) + * labs(title = "The Tidyverse, and Authors") ``` ] .panel2-tidyverse-auto[ 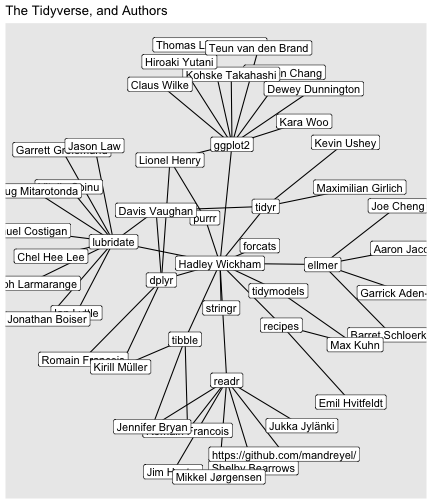<!-- --> ] <style> .panel1-tidyverse-auto { color: black; width: 38.6060606060606%; hight: 32%; float: left; padding-left: 1%; font-size: 80% } .panel2-tidyverse-auto { color: black; width: 59.3939393939394%; hight: 32%; float: left; padding-left: 1%; font-size: 80% } .panel3-tidyverse-auto { color: black; width: NA%; hight: 33%; float: left; padding-left: 1%; font-size: 80% } </style> --- count: false .panel1-hadleyverse-auto[ ``` r *package_author_data ``` ] .panel2-hadleyverse-auto[ ``` # A tibble: 56 × 2 Package Author <chr> <chr> 1 dplyr Hadley Wickham 2 dplyr Romain François 3 dplyr Lionel Henry 4 dplyr Kirill Müller 5 dplyr Davis Vaughan 6 ellmer Hadley Wickham 7 ellmer Joe Cheng 8 ellmer Aaron Jacobs 9 ellmer Garrick Aden-Buie 10 ellmer Barret Schloerke # ℹ 46 more rows ``` ] --- count: false .panel1-hadleyverse-auto[ ``` r package_author_data |> * filter(Author == "Hadley Wickham") ``` ] .panel2-hadleyverse-auto[ ``` # A tibble: 12 × 2 Package Author <chr> <chr> 1 dplyr Hadley Wickham 2 ellmer Hadley Wickham 3 forcats Hadley Wickham 4 ggplot2 Hadley Wickham 5 lubridate Hadley Wickham 6 purrr Hadley Wickham 7 readr Hadley Wickham 8 recipes Hadley Wickham 9 stringr Hadley Wickham 10 tibble Hadley Wickham 11 tidymodels Hadley Wickham 12 tidyr Hadley Wickham ``` ] --- count: false .panel1-hadleyverse-auto[ ``` r package_author_data |> filter(Author == "Hadley Wickham") |> * mutate(Author = "Tidyverse") ``` ] .panel2-hadleyverse-auto[ ``` # A tibble: 12 × 2 Package Author <chr> <chr> 1 dplyr Tidyverse 2 ellmer Tidyverse 3 forcats Tidyverse 4 ggplot2 Tidyverse 5 lubridate Tidyverse 6 purrr Tidyverse 7 readr Tidyverse 8 recipes Tidyverse 9 stringr Tidyverse 10 tibble Tidyverse 11 tidymodels Tidyverse 12 tidyr Tidyverse ``` ] --- count: false .panel1-hadleyverse-auto[ ``` r package_author_data |> filter(Author == "Hadley Wickham") |> mutate(Author = "Tidyverse") |> * ggraph(layout = "kk") ``` ] .panel2-hadleyverse-auto[ <!-- --> ] --- count: false .panel1-hadleyverse-auto[ ``` r package_author_data |> filter(Author == "Hadley Wickham") |> mutate(Author = "Tidyverse") |> ggraph(layout = "kk") + * geom_edge_link() ``` ] .panel2-hadleyverse-auto[ 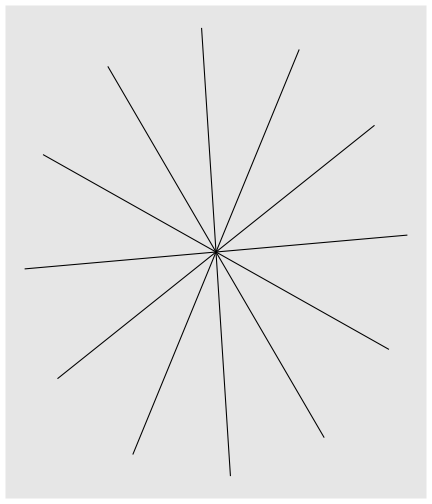<!-- --> ] --- count: false .panel1-hadleyverse-auto[ ``` r package_author_data |> filter(Author == "Hadley Wickham") |> mutate(Author = "Tidyverse") |> ggraph(layout = "kk") + geom_edge_link() + * geom_node_point() ``` ] .panel2-hadleyverse-auto[ <!-- --> ] --- count: false .panel1-hadleyverse-auto[ ``` r package_author_data |> filter(Author == "Hadley Wickham") |> mutate(Author = "Tidyverse") |> ggraph(layout = "kk") + geom_edge_link() + geom_node_point() + * geom_node_label(aes(label = name)) ``` ] .panel2-hadleyverse-auto[ <!-- --> ] <style> .panel1-hadleyverse-auto { color: black; width: 38.6060606060606%; hight: 32%; float: left; padding-left: 1%; font-size: 80% } .panel2-hadleyverse-auto { color: black; width: 59.3939393939394%; hight: 32%; float: left; padding-left: 1%; font-size: 80% } .panel3-hadleyverse-auto { color: black; width: NA%; hight: 33%; float: left; padding-left: 1%; font-size: 80% } </style> --- count: false .panel1-ggdims-2[ ``` r package_author_data |> filter(Author == "Hadley Wickham") |> mutate(Author = "Tidyverse") |> bind_rows(tribble(~Package, ~Author, * "ggdims", "ggplot2", * "ggdims", "tidymodels")) |> ggraph(layout = "kk") + geom_edge_link() + geom_node_point() + geom_node_label(aes(label = name)) ``` ] .panel2-ggdims-2[ <!-- --> ] --- count: false .panel1-ggdims-2[ ``` r package_author_data |> filter(Author == "Hadley Wickham") |> mutate(Author = "Tidyverse") |> bind_rows(tribble(~Package, ~Author, * "ggdims", "ggplot2", * "ggdims", "tidymodels")) |> ggraph(layout = "kk") + geom_edge_link() + geom_node_point() + geom_node_label(aes(label = name)) ``` ] .panel2-ggdims-2[ <!-- --> ] <style> .panel1-ggdims-2 { color: black; width: 38.6060606060606%; hight: 32%; float: left; padding-left: 1%; font-size: 80% } .panel2-ggdims-2 { color: black; width: 59.3939393939394%; hight: 32%; float: left; padding-left: 1%; font-size: 80% } .panel3-ggdims-2 { color: black; width: NA%; hight: 33%; float: left; padding-left: 1%; font-size: 80% } </style> --- count: false .panel1-ggregions-2[ ``` r package_author_data |> filter(Author == "Hadley Wickham") |> mutate(Author = "Tidyverse") |> bind_rows(tribble(~Package, ~Author, "ggdims", "ggplot2", "ggdims", "tidymodels", * "ggregions", "ggplot2", * "ggregions", "sf")) |> bind_rows() |> ggraph(layout = "kk") + geom_edge_link() + geom_node_point() + geom_node_label(aes(label = name)) ``` ] .panel2-ggregions-2[ <!-- --> ] --- count: false .panel1-ggregions-2[ ``` r package_author_data |> filter(Author == "Hadley Wickham") |> mutate(Author = "Tidyverse") |> bind_rows(tribble(~Package, ~Author, "ggdims", "ggplot2", "ggdims", "tidymodels", * "ggregions", "ggplot2", * "ggregions", "sf")) |> bind_rows() |> ggraph(layout = "kk") + geom_edge_link() + geom_node_point() + geom_node_label(aes(label = name)) ``` ] .panel2-ggregions-2[ <!-- --> ] <style> .panel1-ggregions-2 { color: black; width: 38.6060606060606%; hight: 32%; float: left; padding-left: 1%; font-size: 80% } .panel2-ggregions-2 { color: black; width: 59.3939393939394%; hight: 32%; float: left; padding-left: 1%; font-size: 80% } .panel3-ggregions-2 { color: black; width: NA%; hight: 33%; float: left; padding-left: 1%; font-size: 80% } </style> --- count: false .panel1-ggplyr-2[ ``` r package_author_data |> filter(Author == "Hadley Wickham") |> mutate(Author = "Tidyverse") |> bind_rows(tribble(~Package, ~Author, "ggdims", "ggplot2", "ggdims", "tidymodels", "ggregions", "ggplot2", "ggregions", "sf", * "ggplyr", "ggplot2", * "ggplyr", "dplyr")) |> ggraph(layout = "kk") + geom_edge_link() + geom_node_point() + geom_node_label(aes(label = name)) ``` ] .panel2-ggplyr-2[ <!-- --> ] --- count: false .panel1-ggplyr-2[ ``` r package_author_data |> filter(Author == "Hadley Wickham") |> mutate(Author = "Tidyverse") |> bind_rows(tribble(~Package, ~Author, "ggdims", "ggplot2", "ggdims", "tidymodels", "ggregions", "ggplot2", "ggregions", "sf", * "ggplyr", "ggplot2", * "ggplyr", "dplyr")) |> ggraph(layout = "kk") + geom_edge_link() + geom_node_point() + geom_node_label(aes(label = name)) ``` ] .panel2-ggplyr-2[ <!-- --> ] <style> .panel1-ggplyr-2 { color: black; width: 38.6060606060606%; hight: 32%; float: left; padding-left: 1%; font-size: 80% } .panel2-ggplyr-2 { color: black; width: 59.3939393939394%; hight: 32%; float: left; padding-left: 1%; font-size: 80% } .panel3-ggplyr-2 { color: black; width: NA%; hight: 33%; float: left; padding-left: 1%; font-size: 80% } </style> --- count: false .panel1-ggtab-2[ ``` r package_author_data |> filter(Author == "Hadley Wickham") |> mutate(Author = "Tidyverse") |> bind_rows(tribble(~Package, ~Author, "ggdims", "ggplot2", "ggdims", "tidymodels", "ggregions", "ggplot2", "ggregions", "sf", "ggplyr", "ggplot2", "ggplyr", "dplyr", * "ggtab", "ggplot2", * "ggtab", "tidyr", * "ggtab", "dplyr")) |> bind_rows() |> ggraph(layout = "kk") + geom_edge_link() + geom_node_point() + geom_node_label(aes(label = name)) + labs(title = "My areas of interest...") ``` ] .panel2-ggtab-2[ <!-- --> ] --- count: false .panel1-ggtab-2[ ``` r package_author_data |> filter(Author == "Hadley Wickham") |> mutate(Author = "Tidyverse") |> bind_rows(tribble(~Package, ~Author, "ggdims", "ggplot2", "ggdims", "tidymodels", "ggregions", "ggplot2", "ggregions", "sf", "ggplyr", "ggplot2", "ggplyr", "dplyr", * "ggtab", "ggplot2", * "ggtab", "tidyr", * "ggtab", "dplyr")) |> bind_rows() |> ggraph(layout = "kk") + geom_edge_link() + geom_node_point() + geom_node_label(aes(label = name)) + labs(title = "My areas of interest...") ``` ] .panel2-ggtab-2[ <!-- --> ] <style> .panel1-ggtab-2 { color: black; width: 38.6060606060606%; hight: 32%; float: left; padding-left: 1%; font-size: 80% } .panel2-ggtab-2 { color: black; width: 59.3939393939394%; hight: 32%; float: left; padding-left: 1%; font-size: 80% } .panel3-ggtab-2 { color: black; width: NA%; hight: 33%; float: left; padding-left: 1%; font-size: 80% } </style> --- Data science in 2026... -- Fluent with code? -- Fluent with 'moves' -- Being able to express yourself about moves you've seen and performed, (or can imagine!) -- (be it in code or w/ LLM assistance) -- And being able to compose moves to create coherent, robust, reproducible data products. <!-- adjust font size in this css code chunk, currently 80 --> <style type="text/css"> .remark-code{line-height: 1.5; font-size: 80%} @media print { .has-continuation { display: block; } } code.r.hljs.remark-code{ position: relative; overflow-x: hidden; } code.r.hljs.remark-code:hover{ overflow-x:visible; width: 500px; border-style: solid; } </style>