Stamp some text
stamp_text.RdThis function adds a text annotation layer
stamp_text(
  x = 0,
  y = 0,
  label = "some\ntext",
  text_wrap = FALSE,
  char_width = 40,
  alpha = 1,
  angle = 0,
  color = "black",
  family = "Times",
  fontface = "bold",
  hjust = 0.5,
  lineheight = 0.85,
  size = 8,
  vjust = 0.5,
  xy = NULL,
  parse = FALSE,
  nudge_x = 0,
  nudge_y = 0
)
Arguments
| label | defaults with a message about use |
|---|---|
| alpha | numeric between 0 and 1 indicating transparency, defaults to 1 fully opaque, zero is fully transparent |
| color | a character string indicating color, defaults to "black", for other named colors check out https://evamaerey.github.io/ggplot2_grammar_guide/named_colors |
| family | font family |
| hjust | horizontal justification, between 0 and 1, defaults to .5 |
| lineheight | spacing between lines if text is wrapped |
| size | size of text |
| vjust | vertical justification, between 0 and 1, defaults to .5 |
| xy | a data frame where the first two columns contain x and y positional values |
| parse | If TRUE, the labels will be parsed into expressions and displayed as described in ?plotmath. |
| nudge_x | Horizontal adjustment to nudge labels by. Useful for offsetting text from points, particularly on discrete scales. |
| nudge_y | Vertical adjustment to nudge labels by. Useful for offsetting text from points, particularly on discrete scales. |
Value
Examples
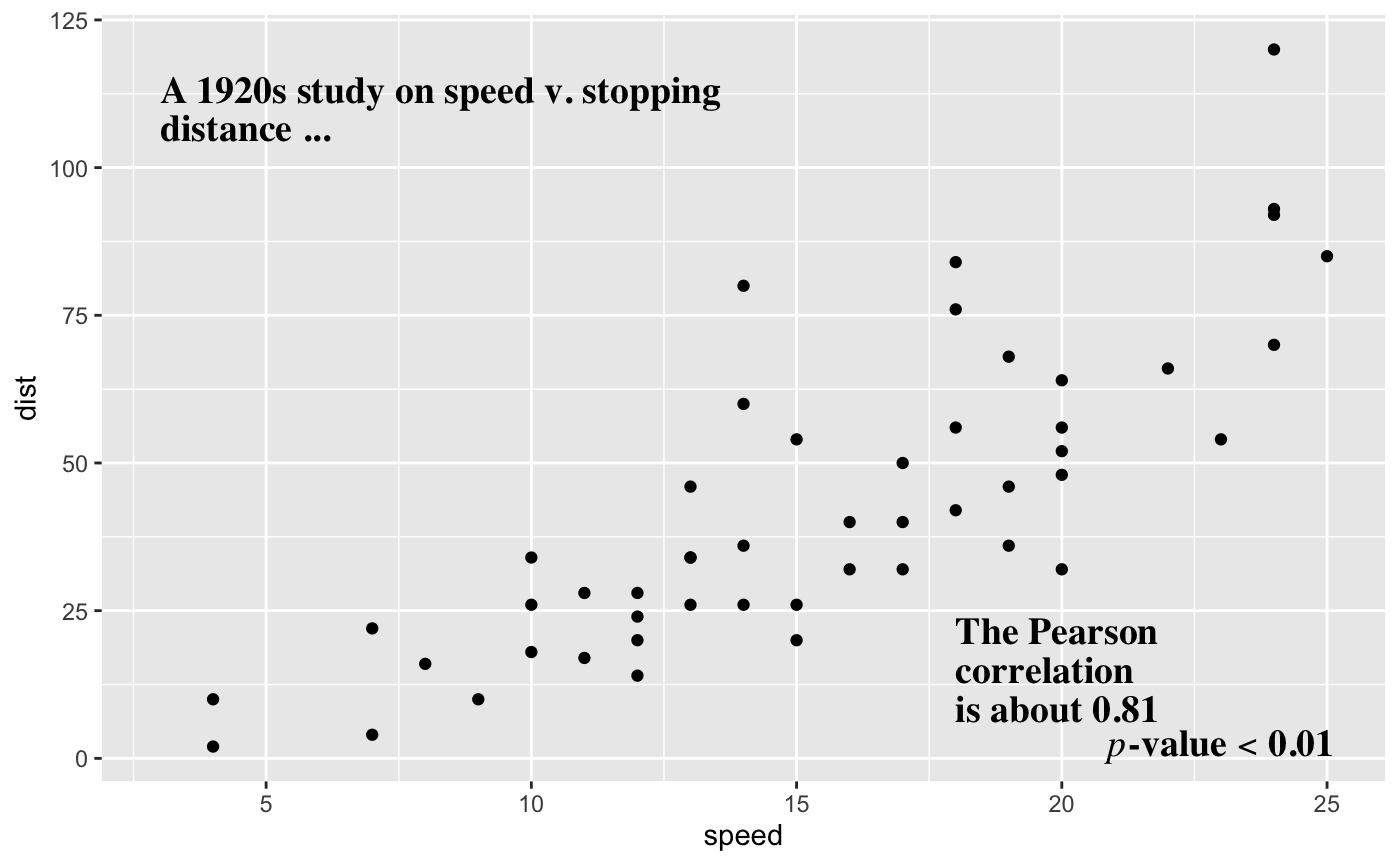
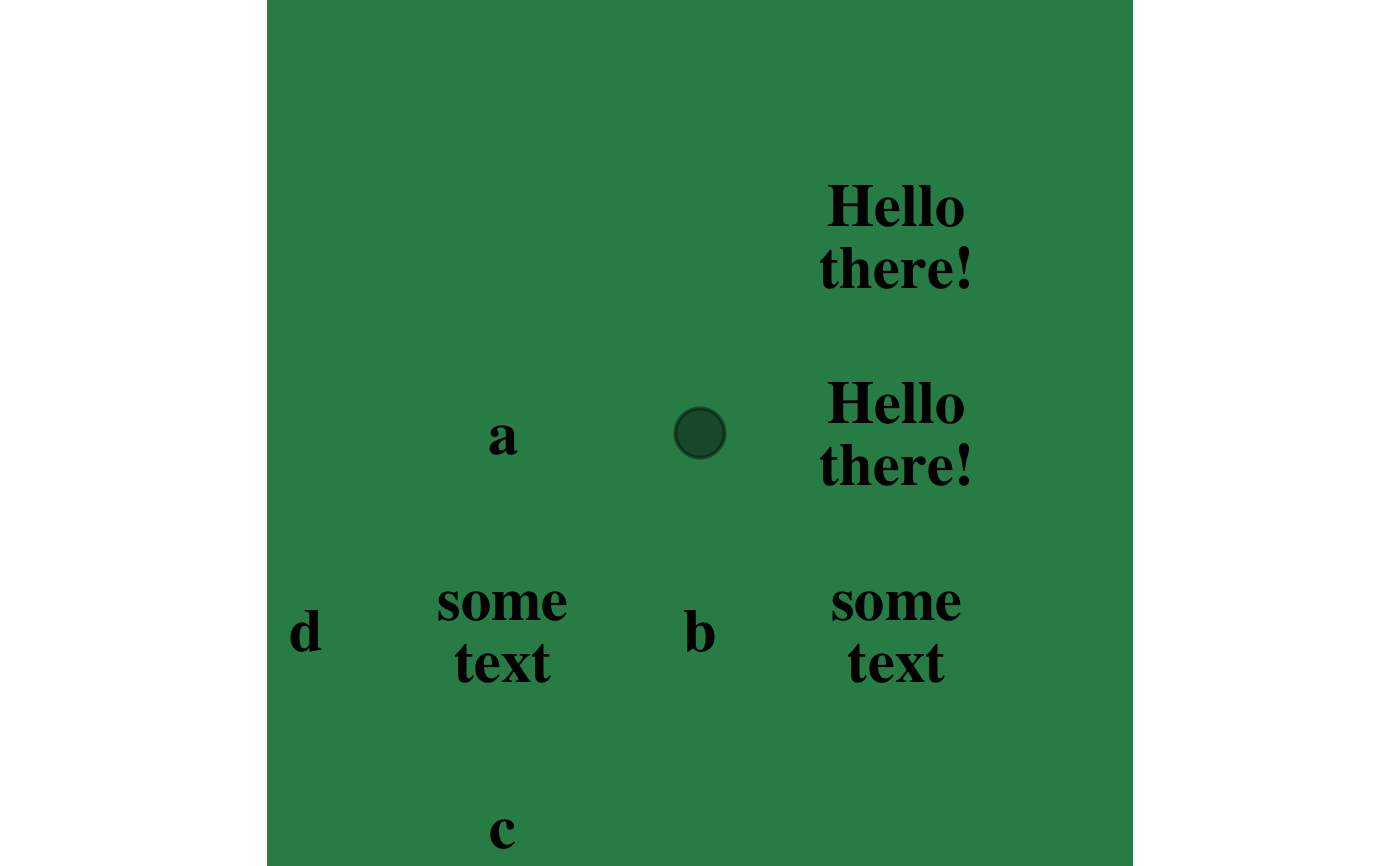
# stamping text on a plot library(ggplot2) ggplot(cars) + aes(speed, dist) + geom_point() + stamp_text(label = "A 1920s study on speed v. stopping distance ...", x = 3, y = 110, size = 5, text_wrap = TRUE, hjust = 0) + stamp_text(label = "The Pearson\ncorrelation\nis about 0.81", x = 18, y = 15, size = 5, hjust = 0) + stamp_text(label = 'bold(italic(p)*"-value"<"0.01")', parse = TRUE, size = 5, x = 23, y = 2)#> #> Pearson's product-moment correlation #> #> data: cars$speed and cars$dist #> t = 9.464, df = 48, p-value = 1.49e-12 #> alternative hypothesis: true correlation is not equal to 0 #> 95 percent confidence interval: #> 0.6816422 0.8862036 #> sample estimates: #> cor #> 0.8068949 #># some more ggcanvas() + stamp_text() + stamp_text(label = letters[1:4], xy = pos_polygon(n = 4)) + stamp_text(x = 2) + scale_x_continuous(limits = c(-1,3)) + stamp_text(y = 1:2, x = 2, label = "Hello\nthere!") + theme_void() + stamp_point(x = 1, y = 1, alpha = .4) + theme(plot.background = element_rect(fill = "seagreen", size = 0)) + scale_y_continuous(limits = c(-1,3))