Stamp a tile (a rectangle)
stamp_tile.RdThis function adds a text annotation layer
stamp_tile(
  x = 0,
  y = 0,
  size = 0.5,
  alpha = 1,
  color = "black",
  fill = "grey85",
  height = 1,
  linetype = "solid",
  width = 1,
  xy = NULL
)
Arguments
| size | numeric value indicating line width, defaults to 1.5 |
|---|---|
| alpha | numeric between 0 and 1 indicating transparency, defaults to 1 fully opaque, zero is fully transparent |
| color | a character string indicating color, defaults to "black", for other named colors check out https://evamaerey.github.io/ggplot2_grammar_guide/named_colors |
| fill | a character string indicating fill color, defaults to "grey35", for other named colors check out https://evamaerey.github.io/ggplot2_grammar_guide/named_colors |
| linetype | a string indicating linetype, "solid", "dashed", "dotted", defaults to "solid" |
Value
Examples
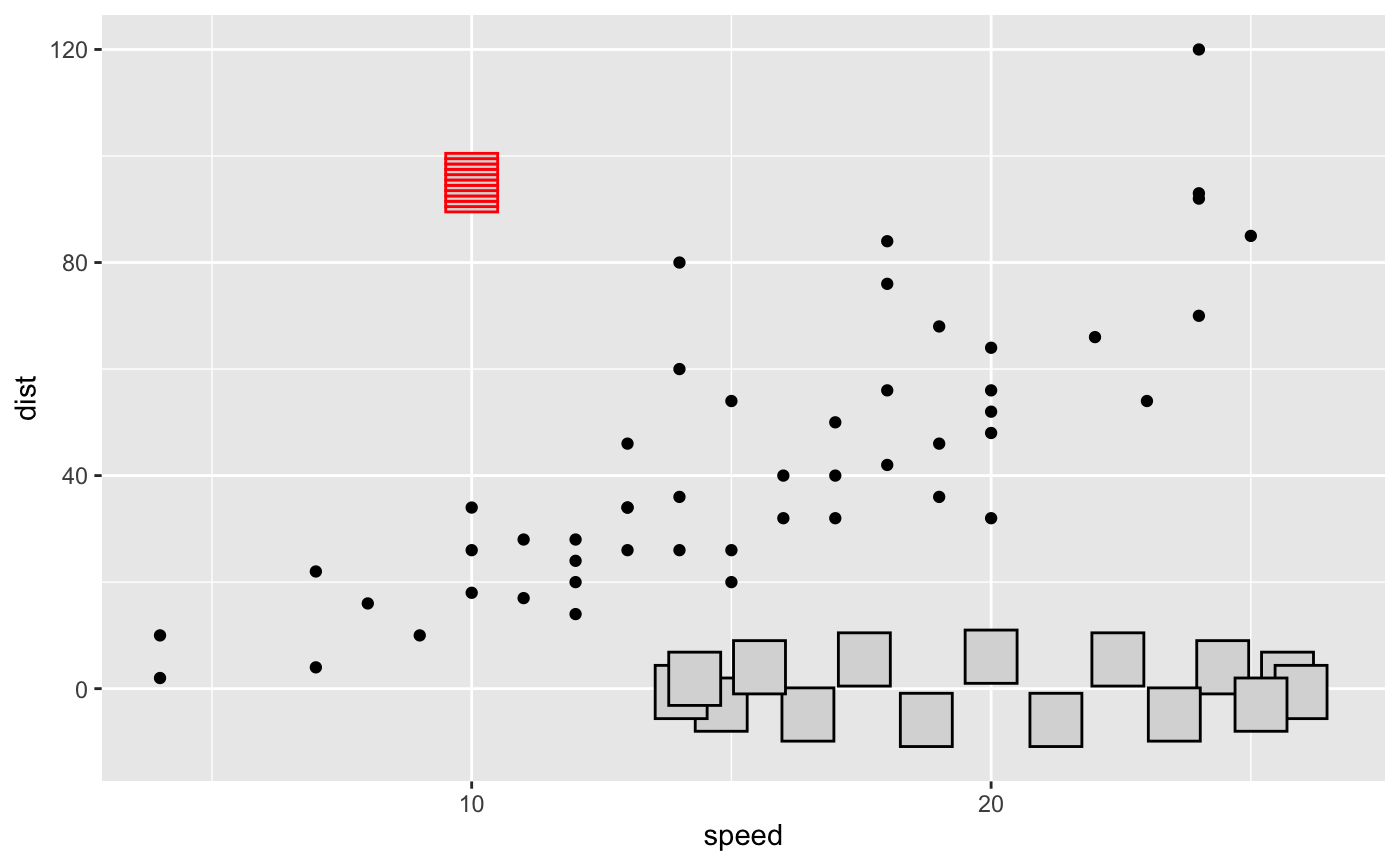
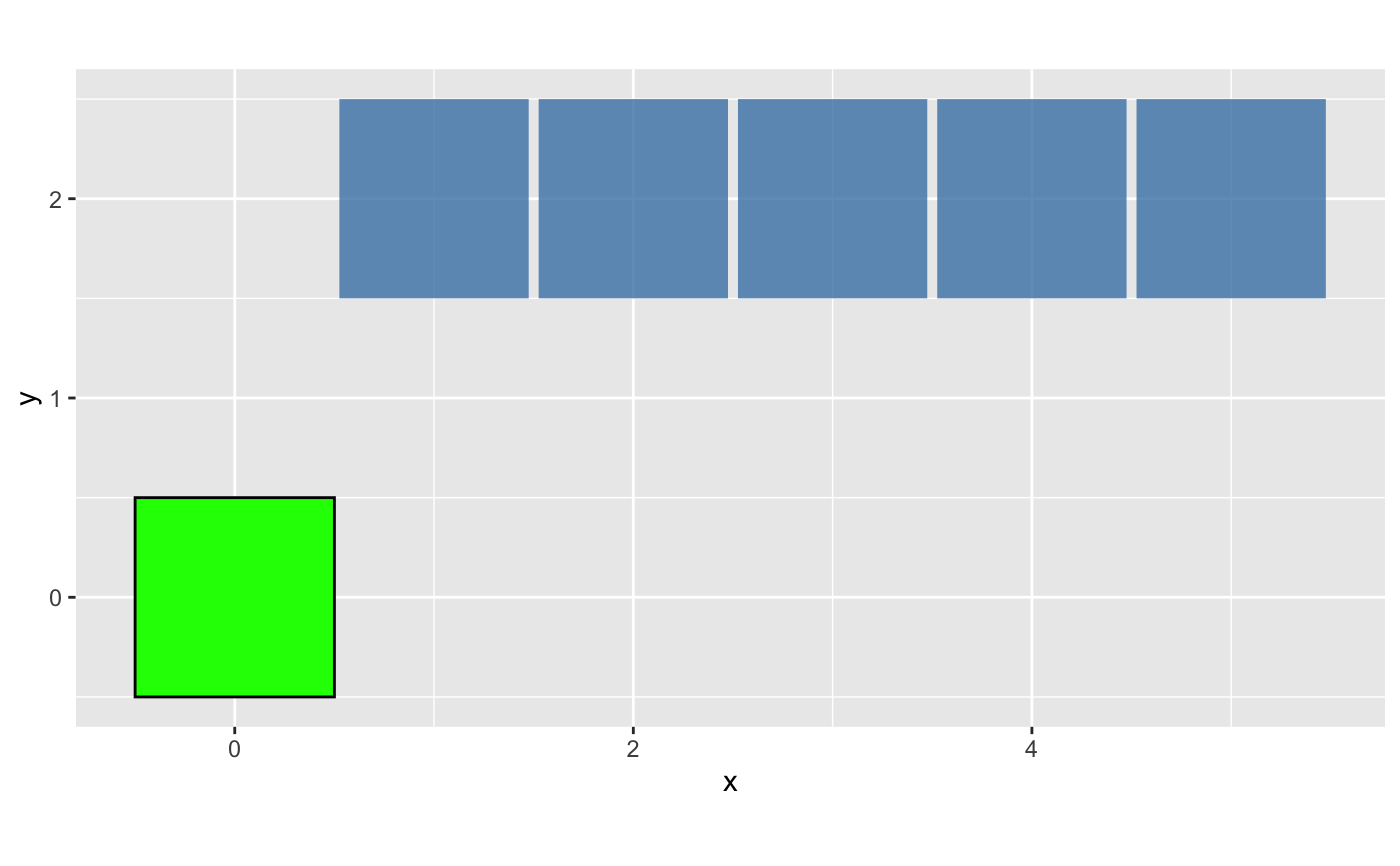
# tile library(ggplot2) ggplot(cars) + aes(speed, dist) + geom_point() + stamp_tile(color = "red", x = 10, y = 90:100) + stamp_tile(height = 10, xy = pos_polygon(x0 = 20, n = 15, radius = 6))# on a canvas ggcanvas() + stamp_tile(fill = "green") + stamp_tile(x = 1:5, y = 2, alpha = .8, fill = "steelblue", width = .95, size = 0) + coord_equal()#>