scale_x_counting
scale_x_counting.RdShow x axis guides with ticks at integers
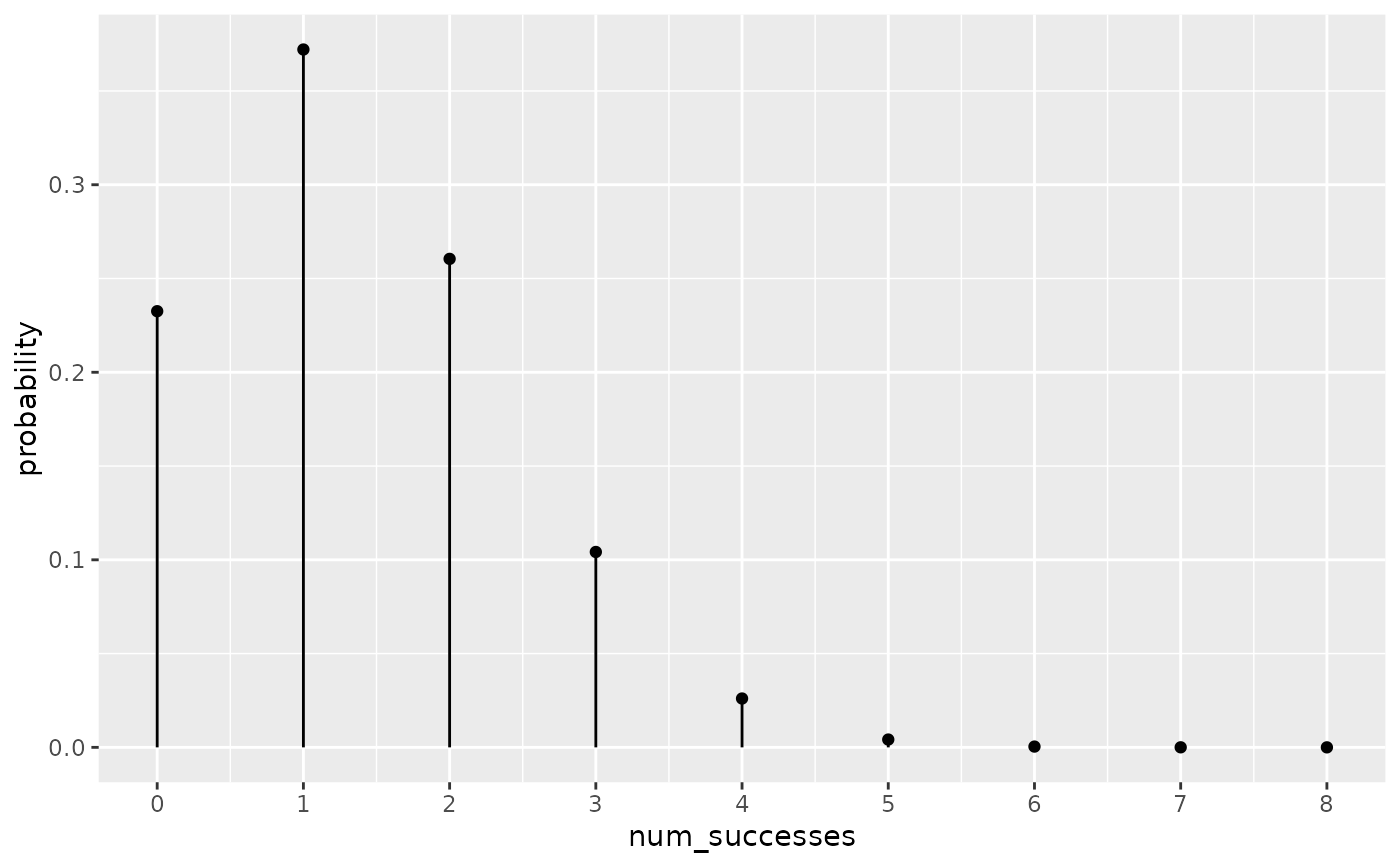
Examples
library(ggplot2)
ggplot(tidy_dbinom(1/6, num_trials = 8)) +
  aes(x = num_successes) +
  scale_x_counting() +
  aes(y = probability) +
  geom_lollipop()
scale_x_counting.RdShow x axis guides with ticks at integers
library(ggplot2)
ggplot(tidy_dbinom(1/6, num_trials = 8)) +
aes(x = num_successes) +
scale_x_counting() +
aes(y = probability) +
geom_lollipop()