Post geom
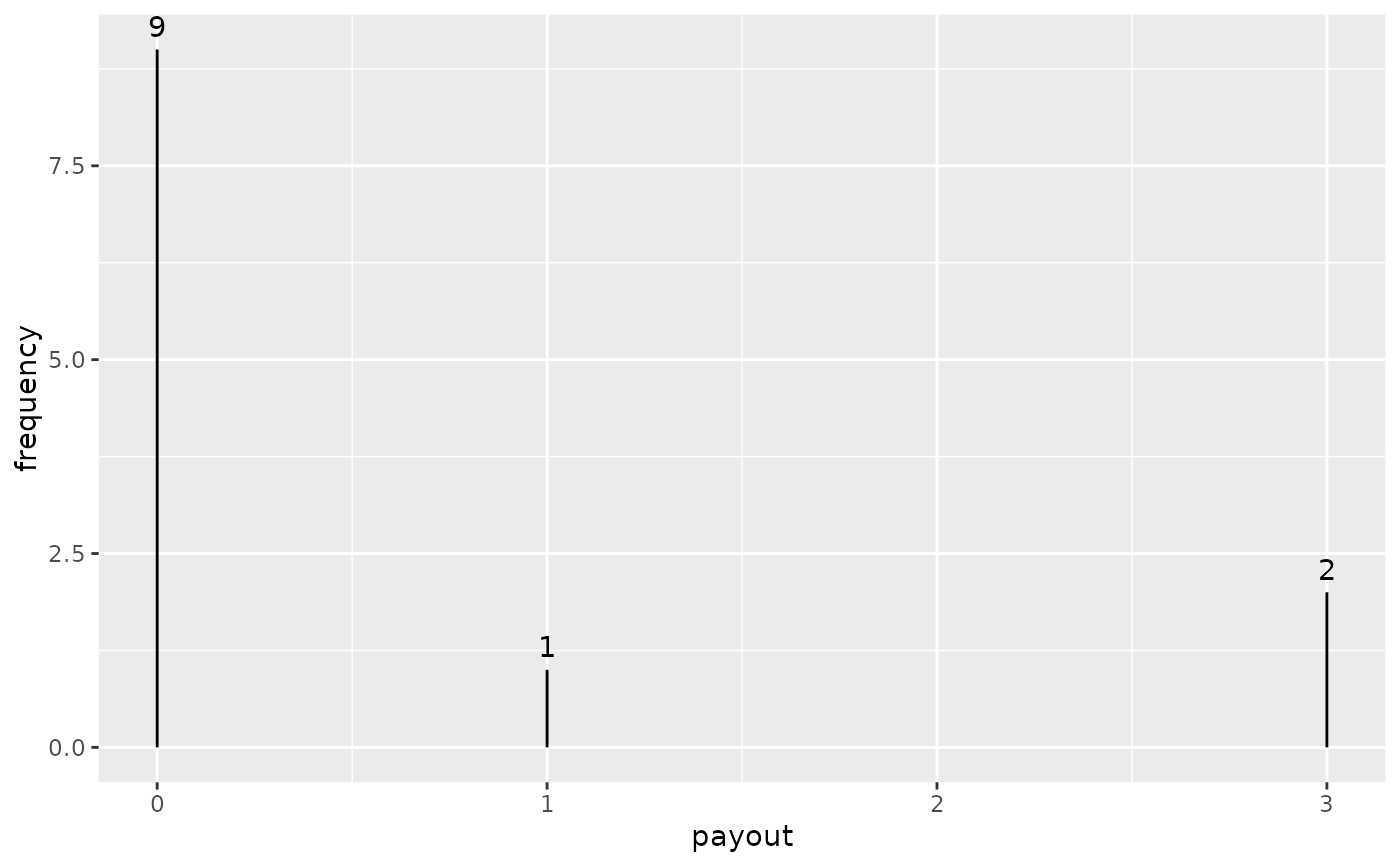
geom_post_label.Rdgeom_post() may be used to visualize discrete quantitative distributions
Usage
geom_post_label(
  mapping = NULL,
  data = NULL,
  position = "identity",
  na.rm = FALSE,
  show.legend = NA,
  inherit.aes = TRUE,
  vjust = -0.6,
  ...
)Examples
library(ggplot2)
ggplot(data = prize_wheel) +
aes(x = payout, y = frequency) +
geom_post() +
geom_post_label()
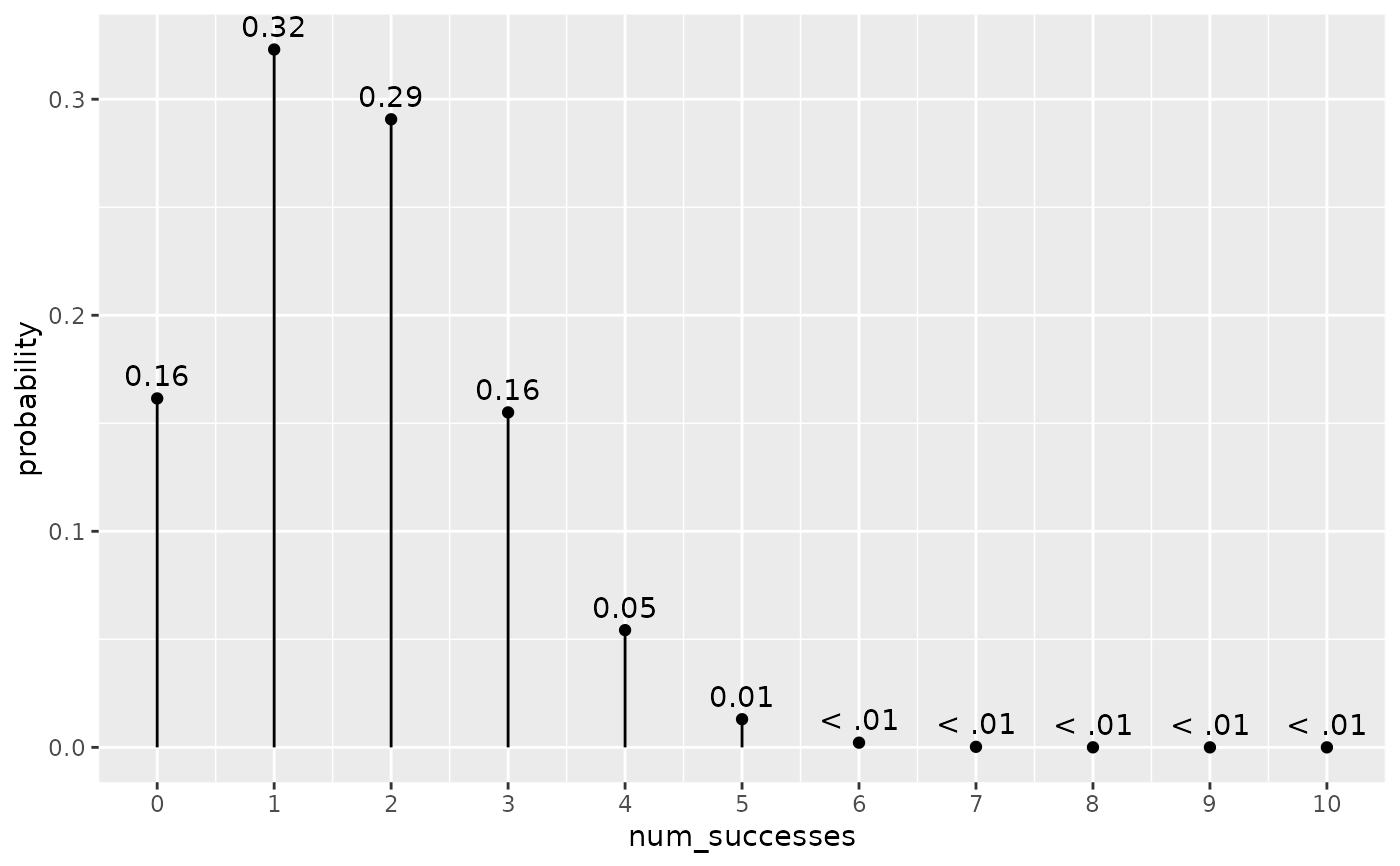
 tidy_dbinom(single_trial_prob = 1/6, num_trials = 10) %>% # from ma206distributions
ggplot() +
aes(x = num_successes,
y = probability) +
geom_lollipop(annotate = TRUE,
round_digits = 2) + # from ma206distributions
scale_x_counting() # from ma206distributions
#> Warning: Ignoring unknown parameters: `round_digits`
#> Warning: Ignoring unknown parameters: `round_digits`
tidy_dbinom(single_trial_prob = 1/6, num_trials = 10) %>% # from ma206distributions
ggplot() +
aes(x = num_successes,
y = probability) +
geom_lollipop(annotate = TRUE,
round_digits = 2) + # from ma206distributions
scale_x_counting() # from ma206distributions
#> Warning: Ignoring unknown parameters: `round_digits`
#> Warning: Ignoring unknown parameters: `round_digits`